Seneca Valley School District
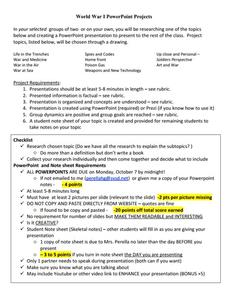
World War I PowerPoint Projects
Use these project guidelines as a start to designing your own class PowerPoint project and to consider what elements you would like to assign and assess in your class. While the resource begins with instructions for researching World War...
Creative Visions Foundation
Production: Filming
After viewing and analyzing documentaries and working in groups to storyboard and prepare, your class should now be ready for the production stage of the documentary process. The eighth lesson in the series, this plan provides...
Shmoop
ELA.CCSS.ELA-Literacy.SL.9-10.5
High schoolers know how to use technology, but they often need more training on how to use it effectively for educational or professional purposes. Try out the activities described here to get your pupils thinking about interesting ways...
Creative Educator
Sell It with Propaganda
Augment a unit on propaganda by prompting class members to create propaganda. Using Frames software, groups demonstrate their understanding of propaganda techniques by designing a new product, creating a commercial to sell their product,...
Curated OER
Create a Video Poem
Collaborate to create a visual version of a poem using video. Before class, choose a poem to pick apart. Read it aloud and then analyze it in detail as a class. Assign a line or short section to each student to expand upon using a...
Curated OER
Design a Book Cover
Class members take on the role of graphic designer and craft a cover for a book they are reading. Individuals formulate a proposal outlining the images they will use to not only grab the interest of readers, but hint at the mood and...
Georgia Department of Education
Ga Virtual Learning: Visual Essay [Pdf]
This PDF is a visual essay assignment in which students create a visual presentation of a choice of poems read previously. It must be planned, organized, and created in such a way that it reflects the meaning of the poem.
Beacon Learning Center
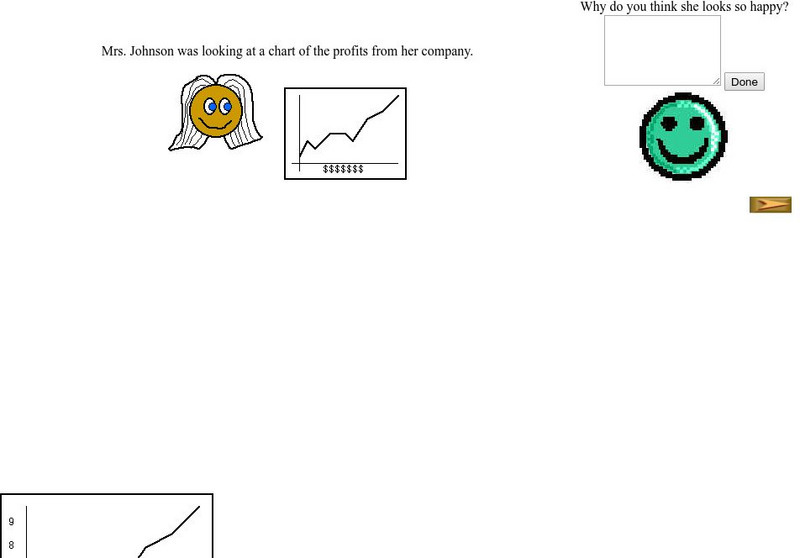
Beacon Learning Center: Interpreting Line Graphs
This site is a lesson on creating and interpreting a line graph. It explains how a line graph is created and then asks questions about what is learned from the data. Students type in open responses, and answers and feedback follow.
Buck Institute
Pbl Works: Presentation Rubric Grades 9 12 (Non Ccss)
[Free Registration/Login Required] This rubric helps teachers guide students in grades 9-12 in making effective presentations in a project, and it can be used to assess their performance. Alignment with CCSS is not noted. It describes an...
Buck Institute
Pbl Works: 9 12 Presentation Rubric (Ccss Aligned)
[Free Registration/Login Required] This rubric helps teachers guide students in grades 9-12 in making effective presentations in a project, and it can be used to assess their performance. Alignment with CC ELA standards for Speaking and...
Other
Ljl Seminars: Using Overhead Transparencies
Here are some tips and rules to be aware of when using overhead transparencies.
Other
Bucks County Community College: Visual Organizers
This site walks you through the benefits of visual organizers, and focuses on a variety of types: tables, charts, graphs, timelines, flowcharts, diagrams, and webs.
New Zealand Ministry of Education
Nz Ministry of Education: Logging Up Reading Mileage
Students will select and enjoy their own range of contemporary and historical texts, display a knowledge of different genre and their particular content, and identify literary aspects of chosen texts for sustained silent reading. They...
Virtual Salt
Virtual Salt: Ideas for Enhancing Oral Reports
A helpful review of important parts of your report and ways to strengthen it. SL.9-10.4 Presentation
Utah Education Network
Uen: Using a Before Reading Organizer With Informational Text
This module provides strategies to use with informational text. Teachers will explicitly teach students about graphic organizers to use before reading informtational texts.
Sophia Learning
Sophia: Creating Graphic Organizers
This tutorial focuses on creating graphic organizers for a variety of purposes. It presents the following types of organizers, their uses, and the format of each: the Cornell method, charting method, cause and effect organizers, flow...
Sophia Learning
Sophia: Note Taking: Concept Maps and Flow Charts
This slideshow lesson focuses on note taking using concept maps and flow charts; it provides background information, 6 types of concept maps or flow charts with best uses, uses in the classroom, uses while reading or researching, and how...
Daily Teaching Tools
Daily Teaching Tools: Free Graphic Organizers for Planning and Writing
This Daily Teaching Tools resource provides graphic organizers that students can use to plan their written pieces. Graphic organizers for all modes of writing are provided.
Texas Education Agency
Texas Gateway: Synthesize Information in Charts and Graphs (English Ii Reading)
Synthesize information that you find in charts and graphs.
Texas Education Agency
Texas Gateway: Evaluate Graphics in Informational/procedural Text
You will learn how to evaluate graphics for their clarity in communicating meaning and achieving a specific purpose.
Texas Education Agency
Texas Gateway: Evaluating Data in Tables, Graphs and Charts
[Accessible by TX Educators. Free Registration/Login Required] In this lesson students look at examples of graphics, tables, charts, and graphs, and learn how to interpret their data. They will be able to use this skill to enhance their...
Texas Education Agency
Texas Gateway: Analyze Graphical Sources: Practice 2 (English Ii Reading)
[Accessible by TX Educators. Free Registration/Login Required] In this lesson, students will learn how to evaluate the clarity and visual appeal of images and other graphic elements included in a reading text. RL.9-10.7 analyze 2 media
Texas Education Agency
Texas Gateway: Choosing Media for a Presentation
[Accessible by TX Educators. Free Registration/Login Required] This lesson will introduce students to the use of visuals and other media in their presentations that will keep their audiences clapping. When preparing for a presentation,...
Texas Education Agency
Texas Gateway: Informational Text: Synthesize Information in Charts and Graphs
In this lesson, you will learn how to understand the data found in charts and graphs, and at the end of the lesson, you will practice what you have learned.


![Ga Virtual Learning: Visual Essay [Pdf] Rubric Ga Virtual Learning: Visual Essay [Pdf] Rubric](https://d15y2dacu3jp90.cloudfront.net/images/attachment_defaults/resource/large/FPO-knovation.png)


