Cynthia J. O'Hora
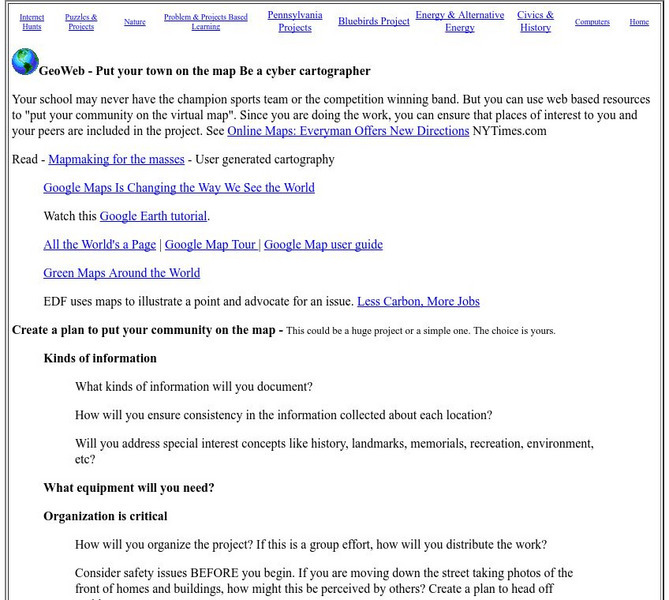
Mrs. O's House: Geo Web: Be a Cyber Cartographer
Take a close look at the resources provided and consider how students can put their school and/or community on the map. Discover cartography, virtual mapping, and points of interest in town or of the school.
Latimer Clarke Corporation
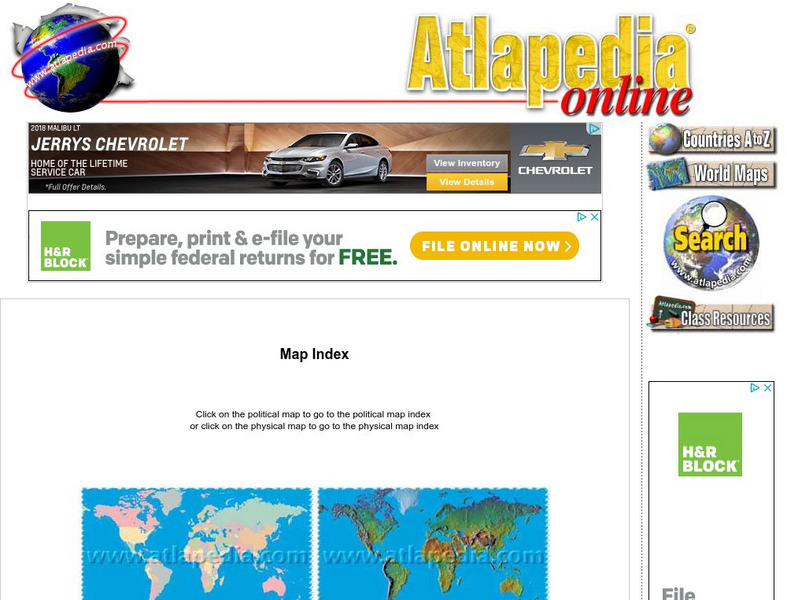
Atlapedia Online: Map Index
This website has a political and a physical map index.
Digital Dialects
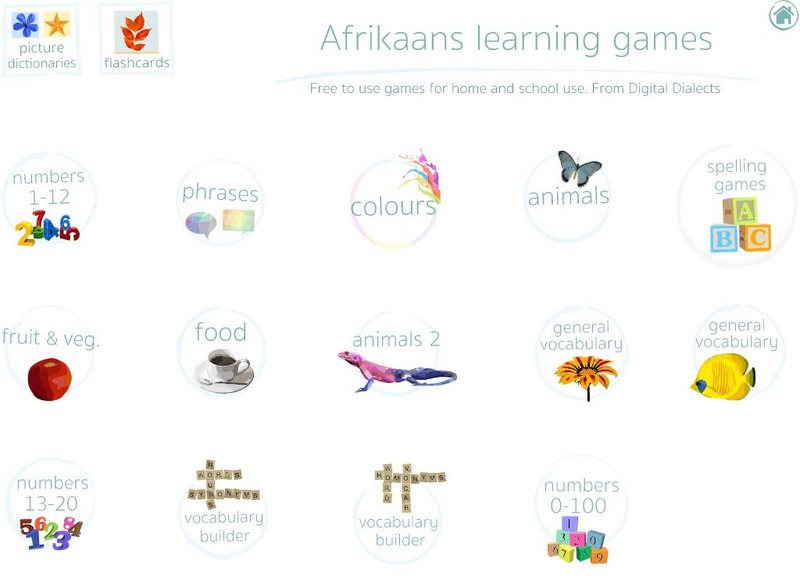
Digital Dialects: Afrikaans
Study Afrikaans with the help of this game collection. There are thirteen activities addressing a variety of vocabulary topics.
Encyclopedia of Earth
Encyclopedia of Earth: Netherlands
The Encyclopedia of Earth provides an overview of Netherlands, including its geography, natural resources, history, government, economy, and much more. Maps and images are also included, along with sources used to create the entry.
Grammarly
Grammarly Handbook: Visuals: Graphs, Charts, and Diagrams
This article explains that graphs, charts, and diagrams are used to display information visually. The choice of what type of graph or chart to use depends on the information to be displayed. Software programs make these much easier to...
Polk Brothers Foundation Center for Urban Education at DePaul University
Depaul University: Center for Urban Education: Illustrate a Text [Pdf]
This module includes links to pages that can be used to illustrate a text. Links to an illustration planner, picture meaning, and show vs. tell resources are included.
Other
Richard Phillips: Making Maps Easy to Read
This geography research project surveys factors that make maps easy to read and to use.
Other
Increased Comprehension With the Use of Imagery
Designed for adult learners, this literacy lesson could easily be used in the high school or middle school classroom. Some handouts are included, but some material must be found in a newspaper or magazine.
Other
The History of Writing
This explanation of the history of writing traces writing from the use of "Counting tokens," to the development of the Roman alphabet. The pictures of how writing has progressed over time is very interesting and helpful.
Other
Text Help: Middle Grades Informational Text [Pdf]
A useful resource with ideas for teachers to meet the Common Core Standard 8.3 for informational text. The ideas are designed for use with the program Read and Write Gold, but could be implemented on paper.
US Geological Survey
Usgs: Finding Your Way With Map and Compass
This resource has a topographic map that tells you where things are and how to get to them. Use this site to help you use a map and compass to determine your location.
The World Bank
World Bank: Agriculture & Rural Development
Graph, map and compare more than 1,000 time series indicators from the World Development Indicators and more than 5,000 indicators from other collections such as Gender Statistics, African Development Indicators, and Education Statistics.
University of Chicago
Ancient Mesopotamia: Math and Measurement: Cuneiform [Pdf]
In this lesson students create and post a chart of the cuneiform symbols for numerals and create their own charts. Then students use the cuneiform numerals to answer questions.
ReadWriteThink
Read Write Think: Double Entry Journal
A printable double-entry journal page along with directions on how to use this type of graphic organize, as well as lists of teaching ideas and related resources.
ReadWriteThink
Read Write Think: I Chart
A printable inquiry chart designed to help students ask questions and collect information from various texts when conducting research on any topic. Directions on how to use this type of graphic organizer as well as lists of teaching...
ReadWriteThink
Read Write Think: K W L S Chart
A printable K-W-L-S sheet to help students activate prior knowledge, ask questions, record new learning, and then ask additional questions to extend inquiry beyond the text . Directions on how to use this type of graphic organize as well...
ReadWriteThink
Read Write Think: Making Connections
A printable graphic organizer for students to use when making text to self, text, and world connections while reading a text. Directions on how to use this type of graphic organize as well as lists of teaching ideas and related resources...
ReadWriteThink
Read Write Think: T Chart
A printable T-chart for students to use when comparing two topics or two sides of one topic. Directions on how to use this graphic organizer as well as lists of teaching ideas and related resources are also provided.
ReadWriteThink
Read Write Think: Doodle Splash: Using Graphics to Discuss Literature
Online instructional activity which allows middle schoolers to create a graphic in understanding a given story/piece of literature. Students create this graphic in groups and then present to the class, offering explanations as to their...
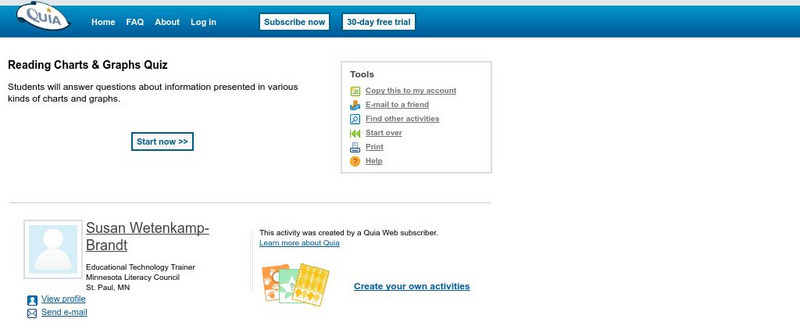
Quia
Quia: Reading Charts and Graphs Quiz
This 25-question quiz asks students to read various kinds of charts and graphs and to select the correct answers to the questions. Immediate feedback is provided after each question. Java is required.
New Zealand Ministry of Education
Nz Ministry of Education: Extra! Extra!
In this lesson students will learn about newspapers including the parts of a newspaper, purpose, and structure of articles. They will gather, record and present information from a variety of sources, using different technologies and...
New Zealand Ministry of Education
Nz Ministry of Education: Verbals on Visuals
This task is to produce a picture book based on relationships. This will aim to combine verbal and visual features to produce a text for a year 7/8 class. Assessment will involve the identification and use of the illustrations, use of...
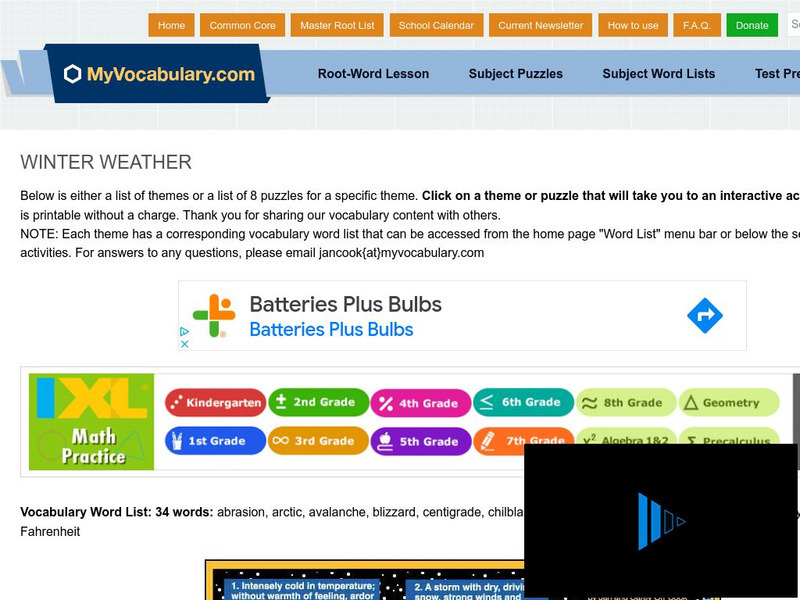
Vocabulary University
My vocabulary.com: Winter Weather
This page offers vocabulary puzzles and activities using 34 vocabulary words pertaining to Winter Weather. It also provides an extensive winter vocabulary list, lesson plan ideas, and information about ice depth and snowflakes.
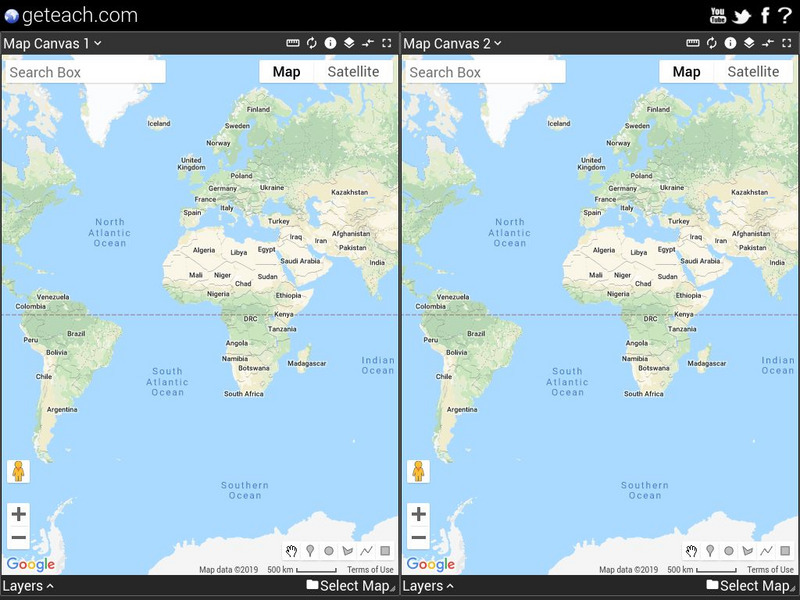
Other
Google Earth Teach: Maps
A free opportunity to allow students and educators to learn and engage using Google Earth. A variety of maps may be selected and multiple layers chosen to display different aspects of each map.




![Depaul University: Center for Urban Education: Illustrate a Text [Pdf] Unit Plan Depaul University: Center for Urban Education: Illustrate a Text [Pdf] Unit Plan](https://content.lessonplanet.com/knovation/original/78082-d640d8eacd08249b4e95371fd0841ddc.jpg?1661787071)


