Quia
Quia: Reading Charts and Graphs Quiz
This 25-question quiz asks students to read various kinds of charts and graphs and to select the correct answers to the questions. Immediate feedback is provided after each question. Java is required.
New Zealand Ministry of Education
Nz Ministry of Education: Extra! Extra!
In this instructional activity students will learn about newspapers including the parts of a newspaper, purpose, and structure of articles. They will gather, record and present information from a variety of sources, using different...
New Zealand Ministry of Education
Nz Ministry of Education: Verbals on Visuals
This task is to produce a picture book based on relationships. This will aim to combine verbal and visual features to produce a text for a year 7/8 class. Assessment will involve the identification and use of the illustrations, use of...
Other
Kim's Korner: Graphic Organizers for Writing and Reading
What are graphic organizers for reading and writing? Use this site to learn more about these learning tools.
Wisc-Online
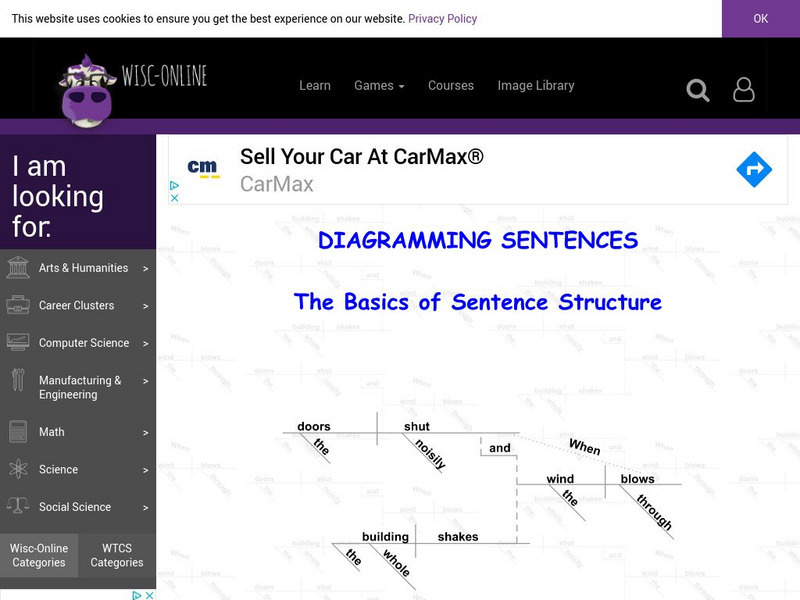
Wisc Online: Diagramming Sentences
Click through information, directions, and examples to learn how to diagram sentences correctly. Practice by putting words into the correct space on diagrams.
Read Works
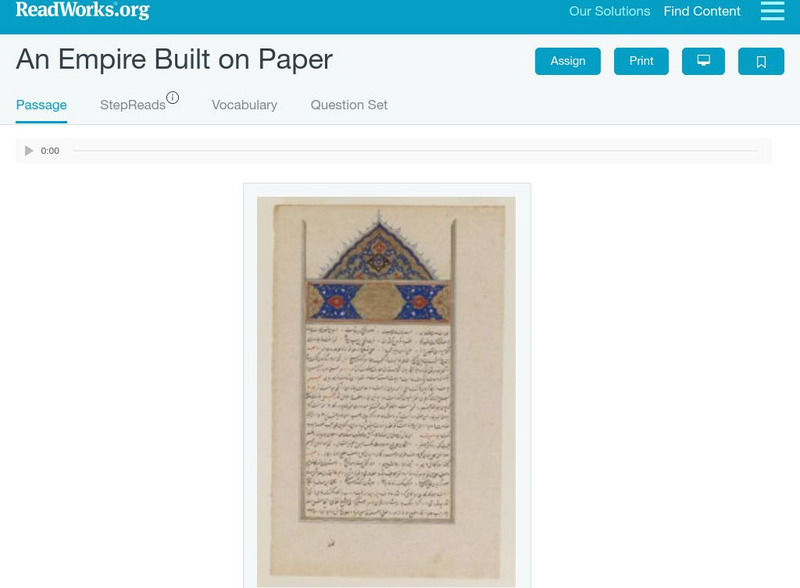
Read Works: An Empire Built on Paper
[Free Registration/Login Required] An informational text about the origin a paper in China. A question sheet is available to help students build skills in reading comprehension.
Read Works
Read Works: Mountain or Molehill?
[Free Registration/Login Required] An informational text about biochar, an ancient idea with some present day uses. A question sheet is available to help students build skills in reading comprehension.
Sophia Learning
Sophia: Choosing Whether to Use Software or Technology to Enhance Ideas
A tutorial explaining how to use technology to create graphics and visuals to enhance documents and presentations. A brief audiovisual presentation identifies types of visuals, and another audiovisual presentation describes how and when...
Sophia Learning
Sophia: Easy to Create Graphic Organizers
Two PDF's that can be viewed online or downloaded and printed. The first is one page showing students several examples of abbreviations that can be used when taking notes. The second is a four pages and shows how different types of...
Colorado State University
Colorado State Writing Center: Charts
The use of charts and graphs can improve your presentations, whether on paper or as visual aids. Here you can read about how to create line, column, bar, pie graphs, and scatterplots. Just follow the links to their respective pages.
Education Development Center
Education Development Center: Tv411: Parts of a Newspaper
Students click through a lesson about the parts of a newspaper and answer questions about the types of articles found in each section, headlines, and captions that would go with photographs. Links to related videos are also provided.
Austin Independent School District
Austin Independent School District: Graphic Organizers [Pdf]
A printable chart shows nine different types of graphic organizers and is followed by a blank copy of each type of organizer, ready to print and use in the classroom. RI.11-12.5 Evaluate text structure
Education Development Center
Tune in to Learning: Reading Charts and Graphs
Practice graph reading skills with these exercises and companion tutorials.
Wisconsin Response to Intervention Center
Wisconsin Rt I Center: Interactive Journals [Pdf]
Classroom teachers will learn about interactive vocabulary journals, engaging instructional strategy tools. They will learn how to implement interactive jounals, understand how to measure progress with interactive journals, find research...
Thinkport Education
Thinkport: Qualitative & Quantitative Information: Tree Destroying Bugs
In this science-themed literacy lesson, middle school students read about an exotic bug and integrate qualitative and quantitative information through close reading and viewing of diagrams.
University of North Carolina
University of North Carolina: The Writing Center: Scientific Reports
A handout exploring how to complete a scientific report based on scientific research. The site describes the sections needed as well as how to insert graphs and tables.
ReadWriteThink
Read Write Think: Creating Magazine Covers to Summarize Texts
In this lesson, students will examine the ways in which a magazine cover's headlines and graphics express the main ideas of its articles. They will then use an interactive tool to create covers that summarize chapters of informational...
Texas Education Agency
Texas Gateway: Analyze Graphical Sources: Practice 2 (English I Reading)
You will look at each of these types of graphs: bar graph, line graph, pie charts, as you work your way through the lesson.
Texas Education Agency
Texas Gateway: Reading Like a Writer: Text Types
This site offers four downloadable videos: 1) Major text types commonly used across content areas; 2) Reading like a Writer, Charting 1; 3) Reading like a Writer, Charting 2; 4) Reading like a Writer, Charting 3. It also offers handouts.
Other
Dade Schools: John Ferguson: Informational Text Features
A table explaining different text features including graphics, visuals, and sections found in text.
Edutopia
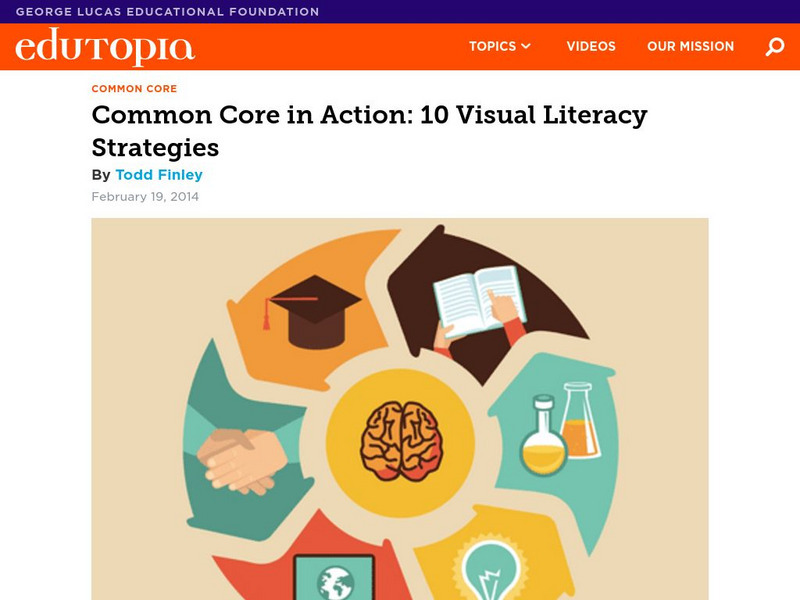
Edutopia: Common Core in Action: 10 Visual Literacy Strategies
Explicitly teach a collection of competencies that will help students think through, think about, and think with pictures.
CPALMS
Cpalms: Graphic Organizers for Science Reading/writing
This resource provides multiple graphic organizers for reading and writing in the science content area. [Registration is required.]
University of South Florida
Fcat Express: Semantic Feature Analysis Worksheet [Pdf]
This is a worksheet in a pdf format on Semantic Feature Analysis. The worksheet, or matrix, is divided into boxes in three rows with four columns across.
E Reading Worksheets
E Reading Worksheets: Text Structures
A complete reading activity covering text structure with several interactive practice questions. Press the "play" button to access the material.


