Texas Education Agency
Texas Gateway: Evaluate Graphics in Informational/procedural Text
You will learn how to evaluate graphics for their clarity in communicating meaning and achieving a specific purpose.
CommonLit
Common Lit: "Propaganda: Battling for the Mind" by Shelby Ostergaard
CommonLit.org is a wonderful resource to use in a Language Arts classroom. Each story or article is accompanied by guided reading questions, assessment questions, and discussion questions. In addition, students can click on words to see...
Texas Education Agency
Texas Gateway: Analyze Clarity of Objectives of a Procedural Text
[Accessible by TX Educators. Free Registration/Login Required] In this lesson, students will learn how to analyze writing in software, warranty, and consumer manuals or publications.
Texas Education Agency
Texas Gateway: Evaluating and Interpreting Media
[Accessible by TX Educators. Free Registration/Login Required] When people talk about media literacy, they are talking about learning to understand what these messages really mean. This lesson will help you take a closer look at a few...
Texas Education Agency
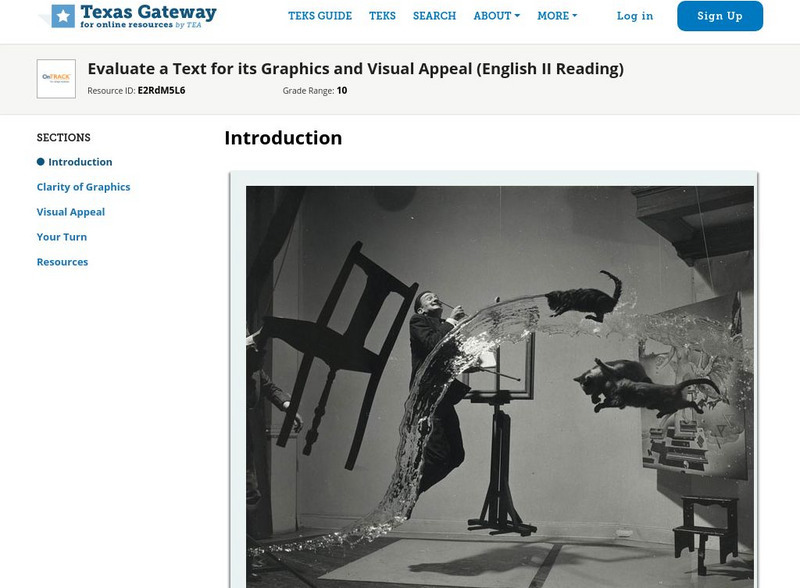
Texas Gateway: Evaluate a Text for Its Graphics and Visual Appeal
Authors add visuals to get your attention, set the tone, or make a point. Sometimes they are successful; sometimes not. This lesson will teach you how to evaluate texts for the clarity of their graphics and for their visual appeal....
Texas Education Agency
Texas Gateway: Evaluating Data in Tables, Graphs and Charts
[Accessible by TX Educators. Free Registration/Login Required] In this lesson students look at examples of graphics, tables, charts, and graphs, and learn how to interpret their data. They will be able to use this skill to enhance their...
Texas Education Agency
Texas Gateway: Analyze Graphical Sources: Practice 2 (English Ii Reading)
[Accessible by TX Educators. Free Registration/Login Required] In this lesson, students will learn how to evaluate the clarity and visual appeal of images and other graphic elements included in a reading text. RL.9-10.7 analyze 2 media
Texas Education Agency
Texas Gateway: Analyze Graphical Sources: Practice 2 (English I Reading)
This lesson focuses on practice exercises to understand and interpret the data in a graphic representations including pie charts, bar graphs, and line graphs.
Thinkport Education
Thinkport: Translating Qualitative & Quantitative Details a New Galaxy
In this science-themed literacy lesson, students learn how to read for and differentiate between qualitative and quantitative information.
Thinkport Education
Thinkport: Translating Qualitative & Quantitative Details: Climate Change
In this science-themed literacy lesson, students read for and differentiate between qualitative and quantitative information.
Texas Education Agency
Texas Gateway: Informational Text: Synthesize Information in Charts and Graphs
In this lesson, you will learn how to understand the data found in charts and graphs, and at the end of the lesson, you will practice what you have learned.
Thinkport Education
Thinkport: Revolution and the Power of Words
A module where students will determine the meaning of unfamiliar terms using prior knowledge, context clues and examination of word parts.
Georgia Department of Education
Ga Virtual Learning: The Elements of Poetry [Pdf]
This is a 2-page PDF of a chart that lists eight elements of poetry, questions to ask concerning each element, and tips and explanations to aid the understanding of each element. RL.9-10.5 text structure effects
AdLit
Ad lit.org: Classroom Strategies: Inquiry Charts (I Charts)
The Inquiry Chart (I-Chart) is a strategy that enables students to generate meaningful questions about a topic and organize their writing. Students integrate prior knowledge or thoughts about the topic with additional information found...
AdLit
Ad lit.org: Develop Fluency Using Content Based Texts
Fluency is the missing piece of the reading puzzle for many older students. They can decode, but they cannot do it automatically and accurately enough to comprehend text. Here are some fluency-building activities to complement content...
AdLit
Ad lit.org: Content Area Literacy: Mathematics
Of all the academic disciplines taught in middle and high school, the one we least expect to entail reading extended texts is in mathematics, but math texts present special literacy problems and challenges for young readers.
Grammarly
Grammarly Handbook: Visuals: Graphs, Charts, and Diagrams
This article explains that graphs, charts, and diagrams are used to display information visually. The choice of what type of graph or chart to use depends on the information to be displayed. Software programs make these much easier to...
Other
Tagxedo
Tagxedo is a tool for making word clouds for visual displays and graphic use. Students insert a piece of text and the words are laid out to form a shape. A Tagxedo can also be created by pulling text in from a website, Twitter handle,...
Vocabulary University
My vocabulary.com: List of Themes for Science & Math
This is a list of interactive vocabulary activities for science and math.
Wisc-Online
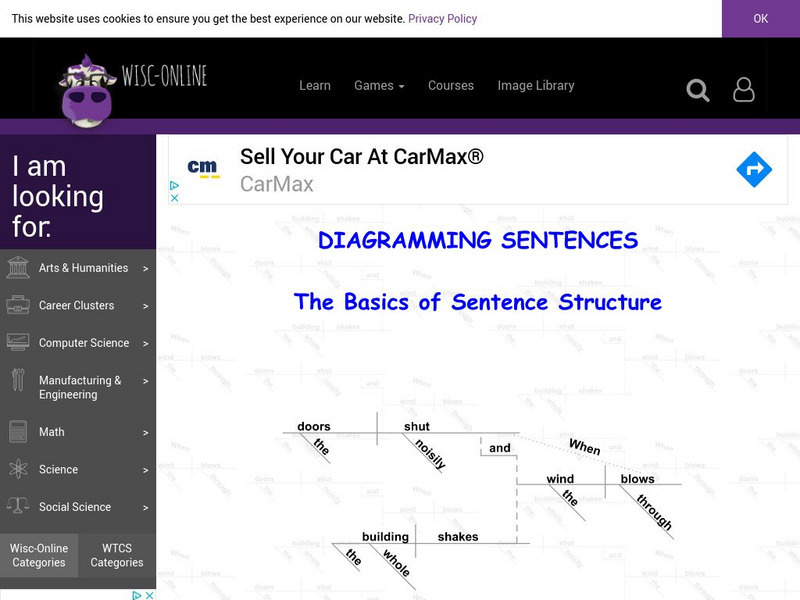
Wisc Online: Diagramming Sentences
Click through information, directions, and examples to learn how to diagram sentences correctly. Practice by putting words into the correct space on diagrams.
Sophia Learning
Sophia: Choosing Whether to Use Software or Technology to Enhance Ideas
A tutorial explaining how to use technology to create graphics and visuals to enhance documents and presentations. A brief audiovisual presentation identifies types of visuals, and another audiovisual presentation describes how and when...
Colorado State University
Colorado State Writing Center: Writing the Scientific Paper
A guide to the world of writing in the scientific field. Includes information about scientific-format papers, abstracts, hypotheses and results, and provides several examples.
Colorado State University
Colorado State Writing Center: Charts
The use of charts and graphs can improve your presentations, whether on paper or as visual aids. Here you can read about how to create line, column, bar, pie graphs, and scatterplots. Just follow the links to their respective pages.
Writing Fix
Writing Fix: Ace: Reading Mathematics [Pdf]
This site includes a graphic organizer to help students use the ACE acronym to help them read word problems with high comprehension. In the graphic organizer, students' reading of word problems requires them to "ask" [A], "choose" [C],...


