Curated OER
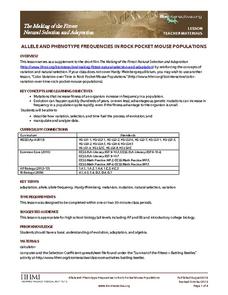
Allele and Phenotype Frequencies in Rock Pocket Mouse Populations
In the deserts of Arizona and New Mexico, some tiny creatures show just how quickly natural selection can turn a mutation into an advantageous adaptation. Watch a video about rock pocket mice, who show that one small change can make all...
Howard Hughes Medical Institute
Icefish Adaptations
What adaptations exist in order for icefish to survive the subfreezing temperatures of the Antarctic Ocean? Middle and high schoolers can find out through watching a related 13-minute video and performing a simple investigation to...
Baylor College
HIV/AIDS in the United States
In the final of five lessons about HIV/AIDS, groups create presentations to share data about the infection rates in the United States, examining demographic and geographic trends over the past ten years. Depending on how much time you...
BioEd Online
Butterflies in Space
How does gravity affect the life cycle of a butterfly? Learn first-hand what types of investigations astronauts perform in space by following along with one of NASA's experiments. Create butterfly habitats in the classroom with specific...
National Center for Case Study Teaching in Science
In Sickness and in Health
Based on family history, how likely is it that a couple's children will have a recessive disease? In an in-depth, but easy-to-follow case study, future geneticists learn the story of Greg and Olga, who are hoping to have children, but...
Howard Hughes Medical Institute
Color Variation over Time in Rock Pocket Mouse Populations
A species-specific look at natural selection, the resource herein examines how adaptations have helped the population of rock pocket mice survive in a changing landscape. To begin, middle or high schoolers watch a 10.5 minute video,...
It's About Time
Energy from Coal
If plastic is derived from fossil fuels and fossil fuels come from dead dinosaurs, does that mean that plastic dinosaurs are made from real dinosaurs? This lesson goes into depth about coal and other fossil fuels. First the instructor...
Will Steger Foundation
The Carbon Cycle - What are its Implications for Climate Policy?
The carbon cycle isn't a bike which produces carbon and this instructional activity explains why. Through reading and discussion, groups of pupils create visual explanations of the four parts of the carbon dioxide oxygen cycle....
Ask a Biologist
Neuron Anatomy Activity
Reinforce the neural connections in the brains of your young biologists with a simple anatomy activity. Looking at the provided diagram of a neuron, students are asked to correctly identify and describe the function of each of the six...
Cmassengale
Photosynthesis Diagrams Worksheet
Help young botanists get to the root of photosynthesis with this series of worksheets. By completing these diagrams, students demonstrate their understanding of the biological structures and chemical reactions that make this amazing...
Curated OER
Centers of the Storm: The Lyceum and the Circle at the University of Mississippi
Greek Revival architecture and the Civil Rights Movement? Sure! Examine how the Lyceum and Circle, two historic buildings located on the campus of the University of Mississippi, relate to integration and the 1962 riot on the university...
Curated OER
Hess's Law
Pupils solve chemical equations. In this chemistry lesson, they balance chemical equations after completing a lab. They can use a TI for this assignment.
Curated OER
Energy Content of Foods
Learners collect data, organize and analyze the data and compare it to real life scenarios. This assignment requires two class periods.
Curated OER
Keep it Bottled Up: Linear Rates of Pressure Increase
Pupils explore linear functions in this lesson when they collect and analyze data as a chemical reaction proceeds. Learners record pressure versus time data and model the data as a linear function. They also examine the concept of slope...
Curated OER
Falling Objects
High schoolers examine the velocities of two different falling objects. They produce distance vs. time and velocity vs. time graphs using a Motion Detector and a CBL 2 to collect experimental data. Learners analyze and interpret the...
Curated OER
When the Snow is as High as an Elephant
High schoolers study the concept of mean values using a data plot. Learners enter the given data in the activity to create their data table. They use the data table to calculate the mean of the snowfall percentage provided in the...
Curated OER
Corn-Crop is a Bin-Buster
Learners calculate percent change and create lists of data. They enter the corresponding bushels of corn measured in billions to their list and display, then convert the acres into scientific notation and use the value on the home screen...
Curated OER
Angling for Distance
Explore the concept of projectile distance through determining the angle that will provide the maximum distance of a launched projectile. Students launch baseballs on a football field and video tape the path of the ball.
Beacon Learning Center
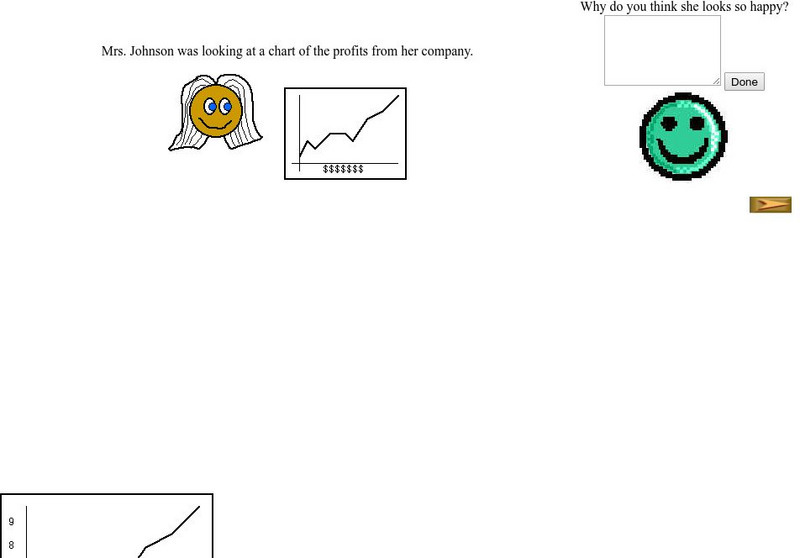
Beacon Learning Center: Interpreting Line Graphs
This site is a lesson on creating and interpreting a line graph. It explains how a line graph is created and then asks questions about what is learned from the data. Students type in open responses, and answers and feedback follow.
Daily Teaching Tools
Daily Teaching Tools: Vocabulary Charts
This Daily Teaching Tools resource provides two reproducible charts for vocabulary acquisition. Students can complete these charts as they encounter new vocabulary words or as a means of reviewing before a vocabulary quiz or test.
Read Works
Read Works: Passages: Predicting the Future
[Free Registration/Login Required] Students read an informational text about the predictions of a futurist and answer questions on comprehension, text support, main idea, vocabulary, and more. Links to a paired text and paired text...
Utah Education Network
Uen: Using a Before Reading Organizer With Informational Text
This module provides strategies to use with informational text. Teachers will explicitly teach students about graphic organizers to use before reading informtational texts.
Sophia Learning
Sophia: Note Taking: Concept Maps and Flow Charts
This slideshow lesson focuses on note taking using concept maps and flow charts; it provides background information, 6 types of concept maps or flow charts with best uses, uses in the classroom, uses while reading or researching, and how...
Other
Center for Assessment: Tools for Examining Text Complexity [Pdf]
Learn how to use several tools to determine text complexity and readability of text for your students.


![Center for Assessment: Tools for Examining Text Complexity [Pdf] Professional Doc Center for Assessment: Tools for Examining Text Complexity [Pdf] Professional Doc](https://d15y2dacu3jp90.cloudfront.net/images/attachment_defaults/resource/large/FPO-knovation.png)