Curated OER
Nutria And The Disappearing Marsh
Young analysts examine changes in the nutria population, vegetation density, and marsh area over time in the wetlands of Louisiana. They import data and use the TI-73 Explorer to graph and analyze the effects of nutria on marsh loss.
Curated OER
Coming to Know F and C
Pupils collect temperatures using a probe and examine data. In this temperature lesson students complete an activity using a graphing calculator.
National Endowment for the Humanities
Background on the Patriot Attitude toward the Monarch
Learners explain the Patriot attitude toward the British monarchy, which helps them embrace the Founders' reluctance to have a strong executive under the Articles of Confederation as well as their desire to build in checks of executive...
Curated OER
Health of Aquatic Life a Real Problem
Learners explore the health of aquatic life in this science lesson They measure and track the oxygen level in the water to determine the health of the aquatic life. They collect this data using the TI explorer to graph and analyze their...
Texas Instruments
When pH Changes What Happens?
Learners explore the pH of water in this fourth through ninth grade science lesson. They test water samples to determine the pH, then record observations at the aquatic site and compare their observations with the pH readings.
Texas Instruments
Can You Breathe Like a Pinniped?
Young learners compare the breathing patterns of different animals in this pinniped lesson. They examine the breathing pattern of California sea lions and northern elephant seals. Pupils collect, compare and analyze data concerning...
Curated OER
Land Erosion - Does Vegetation Matter?
Young learners explore erosion, deposition, weather and climate in this science lesson. They discuss the cause of erosion, collect data and analyze it suing the TI Explorer. They can also use the TI CBL or Vernier LabPro for this...
Curated OER
Let the River Run
Pupils examine deposits found in a river in this science lesson. They collect data of sediment deposit found in the Mississippi river, then graph and analyze their data using the TI.
Texas Instruments
How Do Pinnipeds Stay Warm?
Learners experiment to determine ways different types of insulation materials work. In this animal adaptation activity, they make hand coverings from plastic bags, shortening, feathers, and wool. They observe effects of these insulating...
Texas Instruments
Land Erosion - Running Off With Soil
Learners evaluate the relationship between rainfall and runoff of a small island for one year. In this rainfall vs. runoff lesson, students analyze the relationship between the rainfall and the runoff on Barro Colorado Island over a...
Texas Instruments
Measuring Air Pressure Lab
Your class can investigate the weather through an experiment. For this chemistry lesson, learners collect data on air pressure and relate it to the weather. They collect data with the TI containing a barometer probe.
Curated OER
Biodiversity and Ecosystems
Middle schoolers differentiate between biotic and abiotic factors in this science lesson. Learners collect data for the experiment and analyze the data after graphing it using the CBL 2. This experiment is split into two different...
Curated OER
The Disappearing Kelp Forest
Learners observe the effect "El Nino" left on kelp plants and sea urchins. They analyze the data collected by researchers, by graphing it on a TI calculator. Before graphing and analyzing the data, you may want to revisit the events of...
Curated OER
Match Me!
Young learners explore motion graphs in this activity. They investigate distance-time plots as they move in a specific way in front of the CBR in an attempt to make a motion plot that matches a given plot. Pupils explore the connections...
Curated OER
Shedding Light on the Weather with Relative Humidity
Learners study weather using a graphing calculator in this lesson plan. They collect data for temperature and relative humidity for every hour over a day from the newspaper, then place the data in their handheld calculator and examine it...
Curated OER
Does Clear Water mean Healthy Water?
Learners test their local aquatic site to determine its water clarity. They collect a water sample and measure its turbidity using a sensor, then they repeat the experiment to obtain a second turbidity reading to find the average value.
Curated OER
The Effect of Acid Rain on Limestone
Pupils investigate the pH of rain water in this earth science lesson. They collect rain water from their area and explore the pH when lime stone is added, then they will use the data collected to conjecture as to the effect of acid rain...
Curated OER
Which Way?
Middle schoolers explore distance-time plots. In this algebra lesson, they will investigate how different types of motion affect the distance-time plot.
Curated OER
What's Your Speed?
Learners explore the concept of distance v. time. They use a CBR to collect data on their distance over time, then plot their data using a scatter plot and find an equation to model their data. Pupils discuss what if scenarios which...
Texas Instruments
Light and Day
Pupils explore the concept of collecting data as they collect data on their graphing calculator about time, temperature, and light. Learners plot the data and create histograms and box and whisker plots to analyze the data.
Curated OER
Slow Down - Speed Up
Pupils explore the concept of distance and time as they use a CBR to mimic distance v. time graphs. Learners walk towards and away from the monitor to create various distance v. time graphs, then discuss what motion creates certain graphs.
Curated OER
Lemon "Juice"
Middle schoolers explore the concept of electricity in this lesson as they measure the electricity that a lemon gives off. Learners use volt meters to measure the amount of electricity coming from the lemon. Your class will also...
Boise State University
Paradigm Online Writing Assistant
This online writing assistance offers help in the writing process, grammar and mechanics, usage, and four different types of essays, as well as help on deciding what and how to document.
Beacon Learning Center
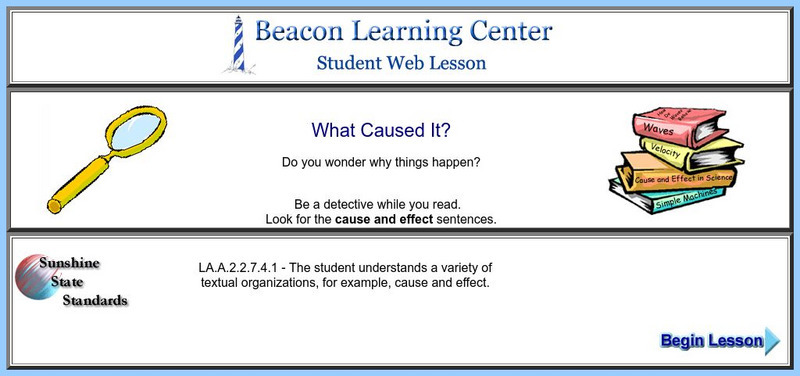
Beacon Learning Center: What Caused It?: Student Web Lesson
Students are asked to be detectives while they read and to look for the cause/effect sentences in the paragraphs. In this instructional activity, students read paragraphs and answer questions about it by either typing in their responses...


