Howard County Schools
Drawing Inverses
An Algebra II instructional activity draws the connection between the exponential function and its inverse. By graphing an exponential function and using tables and a calculator, high schoolers graph the logarithmic function. The plan...
Howard County Schools
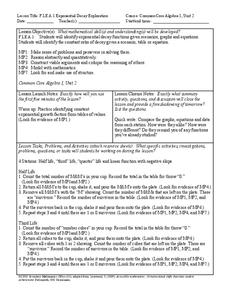
Exponential Decay Exploration
How can you model exponential decay? Explore different situations involving exponential decay functions and decreasing linear functions by performing activities with MandM candy, popcorn kernels, and number cubes.
Howard County Schools
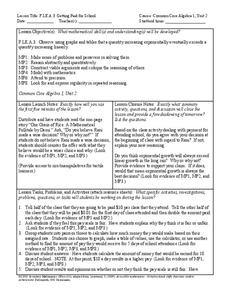
Getting Paid for School
What if you were paid to attend class? What kind of payment schedule would you choose? Learn how exponential functions will eventually exceed linear functions by comparing two different payment schedules for attending class.
Howard County Schools
To Babysit or Not to Babysit?
Would you work for a penny today? Use this activity to highlight the pattern of increase in an exponential function. Scholars compare two options of being paid: one linear and one exponential. Depending on the number of days worked, they...
Howard County Schools
Building a Playground
Scholars crave practical application. Let them use the different models of a quadratic function to plan the size and shape of a school playground. They convert between the different forms and maximize area.
Howard County Schools
Planning for Prom
Make the most of your prom—with math! Pupils write and use a quadratic model to determine the optimal price of prom tickets. After determining the costs associated with the event, learners use a graph to analyze the break even point(s).
Howard County Schools
Setting the Table
How many people can fit around a table? Depends on the size of the table, right? Explore patterns to generate an equation for the number of people that can fit around a table given its size.
Howard County Schools
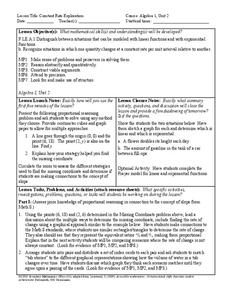
Constant Rate Exploration
Question: What do rectangles and bathtub volume have in common? Answer: Linear equations. Learn how to identify situations that have constant rates by examining two different situations, one proportional and one not proportional.
Howard County Schools
Generous Aunt
Witness the power of exponential growth with an activity that investigates two different savings plans. Class members create tables of values to see how and when a savings plan increasing exponentially exceeds one increasing linearly.
Howard County Schools
Maria’s Quinceañera
How long will it take to save up for a car? Classmates use linear and exponential models to see how money received during a Quinceanera will grow over time.
Howard County Schools
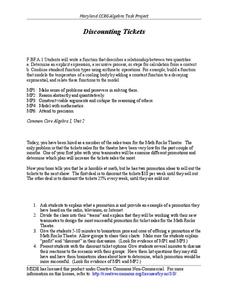
Discounting Tickets
A boss who can't do math? Oh, no! Young entrepreneurs use linear and exponential models to determine which discount will yield the most profit on ticket sales.
National Council of Teachers of Mathematics
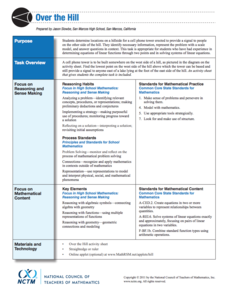
Over the Hill
Can you hear me from there? Pupils determine the place to build a cell tower on a hill. The class uses constraints and creates a scale drawing on a coordinate system to calculate the exact location of the base of the cell tower.
National Council of Teachers of Mathematics
Cash or Gas?
Which option provides the best payout? Pupils predict which lottery prize to take. They devise a method to calculate which prize would likely provide the greatest monetary value.
National Council of Teachers of Mathematics
Bank Shot
Bank on geometry to line up the shot. The resource asks the class to determine the location to bank a cue ball in a game of billiards. Using their knowledge, class members determine where to hit the bumper to make a shot and discuss...
National Council of Teachers of Mathematics
Eruptions: Old Faithful Geyser
How long do we have to wait? Given several days of times between eruptions of Old Faithful, learners create a graphical representation for two days. Groups combine their data to determine an appropriate wait time between eruptions.
National Council of Teachers of Mathematics
Tidal Waves
Periodically ship the class a trigonometric application. Pupils model the level of water in a port. Using their models, learners determine the times that a ship can safely navigate into and out of the port, along with determining other...
Mathematics Assessment Project
Representing Functions of Everyday Situations
Functions help make the world make more sense. Individuals model real-world situations with functions. They match a variety of contexts to different function types to finish a helpful resource.
Mathematics Assessment Project
Representing Quadratic Functions Graphically
Sometimes being different is an advantage. An engaging activity has scholars match cards with quadratic functions in various forms. Along the way, they learn about how each form highlights key features of quadratic functions.
Indiana Department of Education
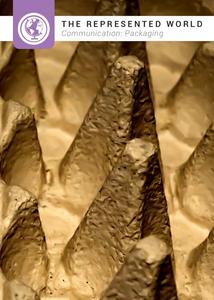
The Represented World: Communication—Packaging
Challenge your classes to design and market a new product. Collaborative groups use geometry skills to create packaging for their products. Finally, they plan a marketing strategy to present to a marketing specialist.
Towson University
Looking Into Lactase: Structured Inquiry
Why is lactase important? Biology scholars explore enzyme function in a structured inquiry lab. The activity tasks lab groups with observing how temperature and pH affect enzyme activity, as well as determining which milk products...
Polar Trec
Drawing Diatoms like Ernst Haeckel
Why do scientists rely on drawings rather than just photographs of their research studies? The lesson introduces drawings of microscopic organisms and the importance of accuracy. Young artists draw organisms and learn why focus and...
Education Development Center
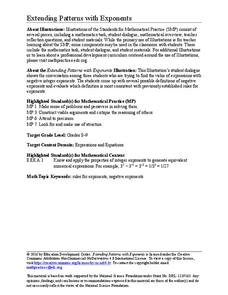
Extending Patterns with Exponents
Don't think negatively about exponents. Young mathematicians dissect a fictional conversation between pupils trying to evaluate an expression with a negative exponent. This allows them to understand the meaning of negative exponents.
Education Development Center
Finding Parallelogram Vertices
Four is the perfect number—if you're talking about parallelograms. Scholars determine a possible fourth vertex of a parallelogram in the coordinate plane given the coordinates of three vertices. They read a conversation...
Education Development Center
Proof with Parallelogram Vertices
Geometric figures are perfect to use for proofs. Scholars prove conjectures about whether given points lie on a triangle and about midpoints. They use a provided dialogue among fictional students to frame their responses.


