EngageNY
Counting Problems
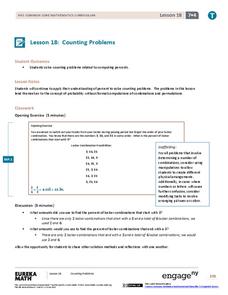
Solving these percent problems is a matter of counting. Pupils find percents by counting the number of events that meet the criteria and the total number of possibilities. Participants create the ratio and convert it to a percent to...
EngageNY
Population Problems
Find the percent of the population that meets the criteria. The 17th segment of a 20-part unit presents problems that involve percents of a population. Pupils use tape diagrams to create equations to find the percents of subgroups of the...
EngageNY
Tax, Commissions, Fees, and Other Real-World Percent Problems
Pupils work several real-world problems that use percents in the 11th portion of a 20-part series. The problems contain percents involved with taxes, commissions, discounts, tips, fees, and interest. Scholars use the equations formed for...
Virginia Department of Education
Arc Length and Area of a Sector
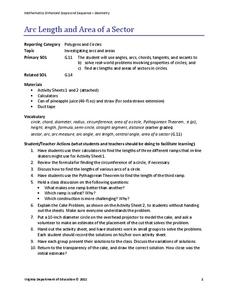
What do skateboarding and baked goods have in common with math? You can use them to connect half-pipe ramps and cakes to arcs and sectors. Pupils compare the lengths of three different ramp options of a skate park. They calculate the...
Virginia Department of Education
Quadratic Modeling
Use a one-stop resource for everything you'd possibly want to teach about quadratic functions and models. Scholars analyze key features of quadratic functions as well as transformations of functions through seven activities....
Virginia Department of Education
Linear Modeling
An inquiry-based algebra lesson plan explores real-world applications of linear functions. Scholars investigate four different situations that can be modeled by linear functions, identifying the rate of change, as well as the strength...
EngageNY
Mixture Problems
What percent of the mixture is juice? Pairs use their knowledge of proportions to determine what percent a mixture is juice given the percent of juice in the components. Pupils use the procedure learned with the juice mixture problem to...
EngageNY
Problem Solving When the Percent Changes
Use more than one whole to solve percent problems. The ninth installment in a 20-part series has pupils work percent problems in which they must determine two wholes. Individuals use double number lines to represent and solve the...
EngageNY
Part of a Whole as a Percent
Pupils use visual models, numeric methods, and equations to solve percent problems. To complete the second installment of 20, they find the part given the percent and the whole, find the percent given the part and the whole, and find the...
Virginia Department of Education
Exploring Statistics
Collect and analyze data to find out something interesting about classmates. Groups devise a statistical question and collect data from their group members. Individuals then create a display of their data and calculate descriptive...
Virginia Department of Education
Analyzing and Interpreting Statistics
Use measures of variance to compare and analyze data sets. Pupils match histograms of data sets to their respective statistical measures. They then use calculated statistics to further analyze groups of data and use the results to make...
Virginia Department of Education
Surface Area and Volume
Partners use materials to wrap three-dimensional objects to determine the formula for surface area. The groups use an orange to calculate the amount of peel it takes to completely cover the fruit. Using manipulatives, individuals then...
Virginia Department of Education
Distance and Midpoint Formulas
Small groups work through two guided activities to derive the distance and midpoint formulas for the coordinate plane. The activities begin with concrete examples and move to abstract.
EngageNY
Applications of the Pythagorean Theorem
Begin seeing the world through the lens of geometry! Use the 19th installment in a 25-part module to apply the Pythagorean Theorem to solve real-world problems. Individuals sketch situations resulting in right triangles such as the...
EngageNY
Distance on the Coordinate Plane
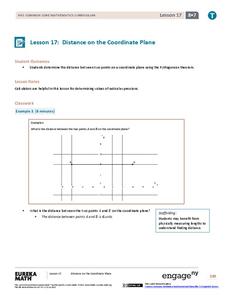
Apply the Pythagorean Theorem to coordinate geometry. Learners find the distance between two points on a coordinate plane by using the Pythagorean Theorem. The vertical and horizontal change creates a right triangle, which allows...
EngageNY
Converting Repeating Decimals to Fractions
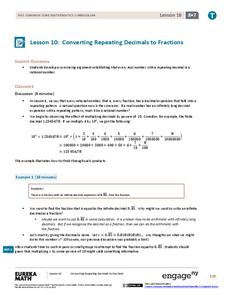
Develop a process with your classes for converting repeating decimals to fractions. Through this process, pupils understand that any repeating decimal can be written as a fraction. The 10th lesson in this 25-part module helps reinforce...
Mathed Up!
Angles: Parallel Lines
Viewers are presented with seven problems with parallel lines and angle relationships and must use the given information to find the measures of specific angles. To finish, they explain their process in finding the measures in the problems.
Virginia Department of Education
Slope-2-Slope
Pupils build on previous experience with slope to investigate positive, negative, zero, and undefined slope. They complete a puzzle matching slope-intercept and standard forms of linear equations.
Virginia Department of Education
Inequalities
Compare graphing an inequality in one variable on a number line to graphing an inequality in two variables on a coordinate plane. Young mathematicians work on a puzzle matching inequalities and their solutions. They then complete a...
Virginia Department of Education
How Much is that Tune?
Tune in for savings! Scholars investigate pricing schemes for two different online music download sites. After comparing the two, they determine the numbers of songs for which each site would be cheaper.
Virginia Department of Education
Algebra Tiles and Solving Equations
Young mathematicians solve linear equations by drawing models of algebra tiles using colored pencils. To finish, they solve the same equations algebraically and check their answers using a graphing calculator.
American Statistical Association
How Tall and How Many?
Is there a relationship between height and the number of siblings? Classmates collect data on their heights and numbers of brothers and sisters. They apply statistical methods to determine if such a relationship exists.
American Statistical Association
You and Michael
Investigate the relationship between height and arm span. Young statisticians measure the heights and arm spans of each class member and create a scatter plot using the data. They draw a line of best fit and use its slope to explain the...
Tech Museum of Innovation
Hoop Glider Design Challenge
The fourth installment of a five-part unit has young engineers designing and testing hoop gliders. They adjust the ratio of the front loop and back loop of the glider to determine the best design for the longest flight.


