Mathed Up!
Trial and Improvement
Try to find an estimate when the exact answer is not clear. Using the General Certificate of Secondary Education Math review resource, pupils learn how to find an estimate to a cubic equation. Class members use the trial-and-improvement...
Mathed Up!
Percentages
Review a percentage of math skills. Designed to review for the General Certificate of Secondary Education Math assessment, the resource provides practice with a variety of percent problems. Items provide pupils problems ranging from...
Howard Hughes Medical Institute
The Mosquito Life Cycle Activity
Understanding the life cycle of a mosquito helps us understand how to prevent the spread of diseases they carry. A lab investigation provides learners with the opportunity to track the two-week life cycle of the mosquito. Scholars make...
CCSS Math Activities
Smarter Balanced Sample Items: 8th Grade Math – Claim 4
A math model is a good model. A slide show presents 10 sample items on modeling and data analysis. Items from Smarter Balanced illustrate different ways that Claim 4 may be assessed on the 8th grade math assessment. The presentation is...
CCSS Math Activities
Smarter Balanced Sample Items: High School Math – Claim 3
Communication is the key. A presentation provides 25 sample items for Claim 3, Communicating Reasoning, for the Smarter Balanced High School Math assessment. Items require pupils to answer the question and provide logical reasoning to...
Howard Hughes Medical Institute
Battling Vector-Borne Diseases: Factors That Affect the Mosquito Life Cycle
Slow the spread of disease by slowing disease carriers in their tracks. Learners explore just how they might accomplish this as they experiment with the life cycle of a mosquito under different conditions. Scholars design and conduct...
Howard Hughes Medical Institute
Beaks as Tools: Selective Advantage in Changing Environments
How does nature select some adaptations over others? Scholars experiment picking up seeds with two different types of tools simulating beaks. After practicing, they experience a drought where one type of seed suddenly isn't available....
Howard Hughes Medical Institute
Evolution in Action: Data Analysis
An environmental factor, such as a drought, sometimes speeds up the rate of natural selection. Scholars analyze data on the beaks of birds around the time of the drought. They compare those that survived to those that perished and find...
Howard Hughes Medical Institute
Got Lactase? Blood Glucose Data Analysis
Many physicals include a blood glucose test, but what are doctors actually testing? Scholars graph and interpret blood glucose data, allowing them to observe the differences in lactase persistence and draw conclusions. They then connect...
Howard Hughes Medical Institute
Finding the Crater
A mass extinction event caused by an impact usually leaves a crater. Scholars use data from 10 different sites around the world trying to determine where to look for the crater. They use data, listing the amount of various minerals to...
Howard Hughes Medical Institute
Using Genetic Crosses to Analyze a Stickleback Trait
Two fish appear different, but how do scientists determine their genotypes? Scholars practice performing test crosses to determine the genotypes of fish given their phenotypes. They answer in-depth comprehension questions and complete...
Howard Hughes Medical Institute
Determining the Size and Energy of the K-T Asteroid
Two different groups of scientists published scientific papers in 1980 offering proof of a large asteroid hitting Earth between the Cretaceous and Tertiary layers of ground. Scholars use a worksheet to analyze the same type of data as...
Corbett Maths
Enlargements
Count on the scale to enlarge a figure. The video shows how to create an enlargement given a scale factor and a center of enlargement. The presenter multiplies the vertical and horizontal distance by the scale factor to find the new...
Corbett Maths
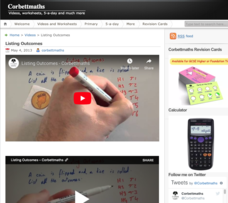
Listing Outcomes
Make a list and check it twice. Many times, it is beneficial to make a list of the possible outcomes when trying to determine a probability. The resource shows how to systematically make a list and then calculate the probability of...
Howard Hughes Medical Institute
Weighing the Evidence for a Mass Extinction: Part 1 – In the Ocean
Extinction events have happen throughout geologic history, but only five mass extinctions occurred over the last 4.5 billion years. Scholars view fossils from a layer of sediment during an extinction event and observe patterns to draw...
American Statistical Association
Don't Spill the Beans!
Become a bean counter. Pupils use a fun activity to design and execute an experiment to determine whether they can grab more beans with their dominant hand or non-dominant hand. They use the class data to create scatter plots and then...
American Statistical Association
Tell it Like it is!
Scholars apply prior knowledge of statistics to write a conclusion. They summarize using correct academic language and tell the story of the data.
American Statistical Association
Exploring Geometric Probabilities with Buffon’s Coin Problem
Scholars create and perform experiments attempting to answer Buffon's Coin problem. They discover the relationships between geometry and probability, empirical and theoretical probabilities, and area of a circle and square.
American Statistical Association
Confidence in Salaries in Petroleum Engineering
Just how confident can we be with statistics calculated from a sample? Learners take this into account as they look at data from a sample of petroleum engineer salaries. They analyze the effect sample size has on a margin of error and...
American Statistical Association
More Confidence in Salaries in Petroleum Engineering
Making inferences isn't an exact science. Using data about salaries, learners investigate the accuracy of their inferences. Their analyses includes simulations and randomization tests as well as population means.
American Statistical Association
Chunk it!
Chunking information helps you remember that information longer. A hands-on activity tests this theory by having learners collect and analyze their own data. Following their conclusions, they conduct randomization simulations to test...
Statistics Education Web
Which Hand Rules?
Reaction rates vary between your dominant and nondominant hand ... or do they? Young scholars conduct an experiment collecting data to answer just that. After collecting data, they calculate the p-value to determine if the difference is...
Statistics Education Web
The Egg Roulette Game
Hard boiled or raw? Which egg will you get? A hands-on activity has scholars explore the impact of conditional probability. Based on a skit from the Tonight Show, pupils model the selection of the two types of eggs using beads. They...
American Statistical Association
Scatter It! (Using Census Results to Help Predict Melissa’s Height)
Pupils use the provided census data to guess the future height of a child. They organize and plot the data, solve for the line of best fit, and determine the likely height and range for a specific age.


