Illustrative Mathematics
High Blood Pressure
Does watching TV increase one's blood pressure? Assess student understanding of how study design dictates whether a conclusion of causation is warranted. Use this as a prompt for a small group or whole class discussion, or as a part of a...
Curated OER
Mean and Standard Deviation
Get two activities with one lesson. The first lesson, is appropriate for grades 6-12 and takes about 20 minutes. It introduces the concept of measures of central tendency, primarily the mean, and discusses its uses as well as its...
Curated OER
Application and Modeling of Standard Deviation
The first activity in this resource has learners computing the mean and standard deviation of two different data sets and drawing conclusions based on their results. The second activity has them using a dice-rolling simulation to...
Illustrative Mathematics
Is This a Parallelogram?
If both pairs of opposite sides of a quadrilateral are congruent, is the quadrilateral a parallelogram? This task asks learners to determine the answer and to support their answer with a proof. The resource includes a commentary for...
Illustrative Mathematics
Reflections and Isosceles Triangles
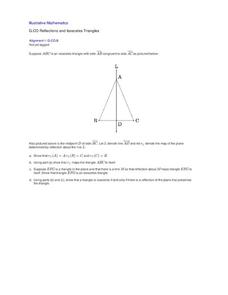
Geometers explore symmetries of isosceles triangles by using rigid transformations of the plane. They complete four tasks, including congruence proofs, which illustrate the relationship between congruence and rigid transformations. The...
Illustrative Mathematics
How is the Weather?
This activity asks learners to interpret data displayed on a graph within the context of the problem. Students are given three graphs that show solar radiation, or intensity of the sun, as a function of time. They are also given three...
Curated OER
Golf and Divorce
There seems to be an interesting relationship between the increasing numbers of golf courses and divorce. Assess student understanding of correlation and causation by asking them to explain what it is. Use this short activity as a class...
Curated OER
Texting and Grades II
Given the least squares regression line, interpret the slope and intercept in the context of the relationship between texting and GPA. Although this task is short and looks simple, some subtle points can be brought to light in a...
Illustrative Mathematics
Words and Music I
What type of music is best to listen to while learning? In a short writing prompt, learners must determine if a scenario involving listening to music while memorizing material is an experiment or an observational study. The prompt also...
Illustrative Mathematics
Sarah, the chimpanzee
Is Sarah, the chimpanzee, smart or just a lucky guesser? Here, learners set up a simulation and read a dotplot to find out the likelihood of getting 7 out of 8 questions correct. One suggested modification would be to have your class...
Curated OER
Sounds Really Good! (sort of...)
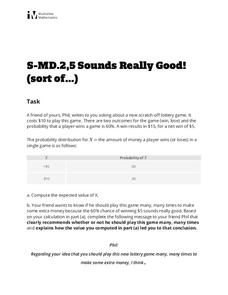
Your friend Phil wants to know if he should play the lottery. Have your class use the given data to compute the expected value and explain to Phil what he should do and why. This handout is ideal for a quick assessment of skill and...
Curated OER
Functions and Their Graphs
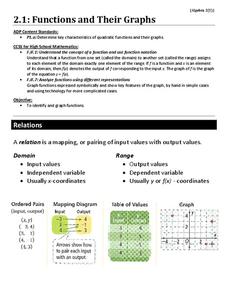
Use a learning exercise to go over the basic concepts of relations and functions. Included are clear definitions and examples of relations, domain and range, and functions and the vertical line test. However, the problems are pretty...
Shodor Education Foundation
An Introduction to Arithmetic and Geometric Sequences
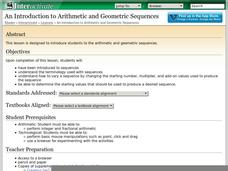
Help your class look for patterns as they create their own arithmetic and geometric sequences. Engage learners with an introductory discussion on sequences and use the applet to let them explore how sequences are formed. Teachers might...
Illustrative Mathematics
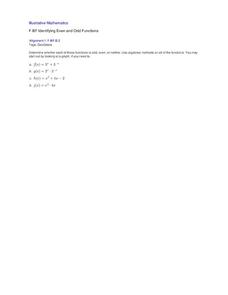
Identifying Even and Odd Functions
Use a worksheet to give learners practice in identifying even and odd functions. The problems on this page are also appropriate for use as assessment items, or you can use them with GeoGebra to interactively present concepts. The task is...
Curated OER
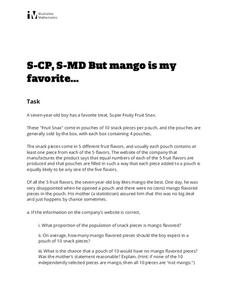
But mango is my favorite…
What are the chances of getting your favorite flavor in your fruit snack package? Have your class use the given information to compute their own experimental data using the multiplication rule of independent events and compare it to the...
Curated OER
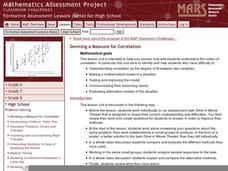
Devising a Measure for Correlation
How well does your class understand the concept of correlation? Use an activity to explore different methods of calculating correlation. Working alone and then in groups, your class will make decisions on what math to apply to the...
Illustrative Mathematics
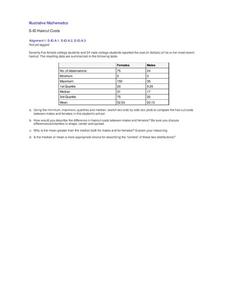
Haircut Costs
Who pays more for haircuts, men or women? Given quartile values, learners construct box and whiskers plots and interpret the results. They compare the mean and median, and discuss which is more appropriate under particular conditions....
Illustrative Mathematics
SAT Scores
If you earned a score of 610 on the math portion of the SAT, what would be your percentile ranking? Given the mean and standard deviation of normally distributed data, find the probability of getting a particular score, or that your...
Illustrative Mathematics
Finding a Chair
Here is an activity that incorporates subtraction in word problems. Youngsters are provided with six word problems that essentially deal with the same numbers in each problem, yet use different comparison language. These problems are...
Curated OER
Coffee and Crime
Is there a correlation between the number of coffee shops and the amount of crime in a given area? In this quick exercise, your class will examine the data, interpret the results, and discuss their conclusion. Concepts covered include...
Illustrative Mathematics
Speed Trap
In which direction is traffic moving faster, north or south? Use box and whisker plots to organize data and interpret the results. Detailed solutions are included. This activity would be good as a warm up or quick assessment at the end...
Illustrative Mathematics
Do You Fit In This Car?
A short activity that focuses on the normal distribution as a model for data distribution. Using given means and standard deviations, your budding statisticians can use statistical tables, calculators, or other statistical software to...
Illustrative Mathematics
Complex number patterns
Start off with the definition of the imaginary number i, then have your class practice simplifying expressions involving powers of i and look for patterns. See how the cyclic nature of powers of i translate to sums of powers of i.
Curated OER
Linear Inequalities in One and Two Variables: Rays and Half Planes
Define rays and half planes, including the concepts of boundary lines and prerequisite knowledge of coordinate planes. Given linear inequalities in one and two variables, your class will compare the differences. They will also graph...


