Council for Economic Education
Calculating Simple Interest
How much is owed? A calculated resource introduces the simple interest formula with a video that describes how to use it. Classmates then show what they know by answering questions within a simple interest worksheet.
American Statistical Association
Don't Spill the Beans!
Become a bean counter. Pupils use a fun activity to design and execute an experiment to determine whether they can grab more beans with their dominant hand or non-dominant hand. They use the class data to create scatter plots and then...
American Statistical Association
How Long is 30 Seconds?
Is time on your side? Pupils come up with an experiment to test whether their classmates can guess how long it takes for 30 seconds to elapse. They divide the class data into two groups, create box-and-whisker plots, and analyze the...
American Statistical Association
Confidence in Salaries in Petroleum Engineering
Just how confident can we be with statistics calculated from a sample? Learners take this into account as they look at data from a sample of petroleum engineer salaries. They analyze the effect sample size has on a margin of error and...
American Statistical Association
More Confidence in Salaries in Petroleum Engineering
Making inferences isn't an exact science. Using data about salaries, learners investigate the accuracy of their inferences. Their analyses includes simulations and randomization tests as well as population means.
American Statistical Association
Scatter It! (Using Census Results to Help Predict Melissa’s Height)
Pupils use the provided census data to guess the future height of a child. They organize and plot the data, solve for the line of best fit, and determine the likely height and range for a specific age.
American Statistical Association
Scatter It! (Predict Billy’s Height)
How do doctors predict a child's future height? Scholars use one case study to determine the height of a child two years into the future. They graph the given data, determine the line of best fit, and use that to estimate the height in...
American Statistical Association
Step into Statastics
Class members study the size of classmates' feet and perform a statistical analysis of their data. They solve for central tendencies, quartiles, and spread for the entire group as well as subgroups. They then write a conclusion based on...
American Statistical Association
What is the Probability of “Pigging Out”
Learners apply their understanding of luck to a probability experiment. They play a game of Pass the Pigs to determine the probability of a specific outcome. Using analysis for their data, pupils declare the measures of center, dot...
American Statistical Association
Bear Hugs
Scholars research arm span to determine who gives the best bear hugs. They use data from a national study to find the standard statistics for arm span. It includes mean, median, quartiles, spread, standard deviation, and more.
American Statistical Association
Armspans
Young mathematicians collect data on the arm spans of classmates. Then they sort the data by measures of center, spread, and standard deviation. Finally, they compare groups, such as boys and girls, to interpret any differences.
Agriculture in the Classroom
Build it Better
If you think you can do better, feel free to give it a try. Pupils learn about the work on Temple Grandin and consider ways to improve animal handling facilities. They work in groups to build models to showcase their ideas.
101 Questions
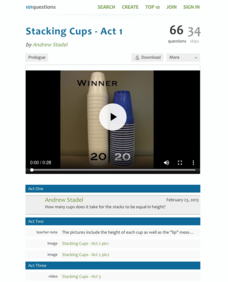
Stacking Cups
Facilitate an understanding of equality using a modeling task. After watching different-sized cups being stacked, learners use their math skills to determine when the height of each cup tower will be the same. Meant as an introduction to...
101 Questions
Shower v. Bath
Which requires more water--a bath or a shower? Given some specific criteria, learners attempt to answer the question. A video shows how long it takes to fill a gallon container using a faucet and a shower head. Using that information and...
101 Questions
Coca Cola Pool
Do the math before you do something crazy—like filling a pool full of Coca-Cola. A video shows a pool owner filling a large backyard pool with bottles of Coke. Scholars use the dimensions of the pool to determine the number of bottles...
101 Questions
25 Billion Apps
Learn to use mathematics to your advantage! Using linear modeling, scholars predict the date and time the Apple App Store reaches 25 billion downloads. Considering the prize for the 25 billionth download was a $10,000 gift card, modeling...
101 Questions
Joulies
Does your coffee get too cold too fast? Joulies just might be your answer! Learners use experimental data to make a conclusion about how effective Joulies are at keeping coffee at the ideal temperature. A video shows the graph of the...
101 Questions
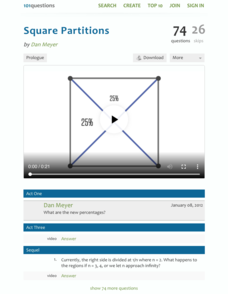
Square Partitions
Challenge your classes while developing their problem-solving skills. A square is divided neatly into four equal triangles by its diagonals until one diagonal is moved from a vertex to the midpoint of one side. Now, scholars must devise...
101 Questions
Bean Counting
Don't spill the beans ... before the end of the lesson! Learners must predict how long it takes two people working together to fill a glass with beans. A video presents the rate it takes each person independently, and another video...
Council for Economic Education
A Lesson on the Supply and Demand of Toy Fads
Let's all Hula Hoop! Scholars research the supply and demand side of toy fads in the United States. They analyze video clips and news articles to complete graphs on how the supply curve slope works in concert with the demand for products...
101 Questions
Sacre Coeur Funicular
Rise to the challenge of trigonometry. Watching a video of an ascending funicular at the Sacre Coeur in Paris sets the stage for a challenging task. Young mathematicians use a given diagram, along with the concepts of slope and...
101 Questions
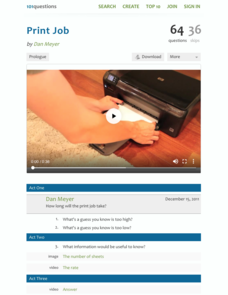
Print Job
A watched printer never finishes—or does it? Engage your classes in a ratio and proportion task that asks them to predict how long it takes to print the numbers one through 88 on 88 sheets of paper. They use video to determine the rate...
101 Questions
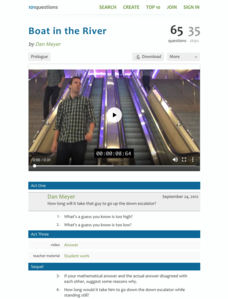
Boat in the River
Ever feel like you're headed up the down escalator? Don't let your pupils get stuck in that rut! Practice writing equations to solve a problem using an engaging lesson. A video presents information that allows learners to determine how...
101 Questions
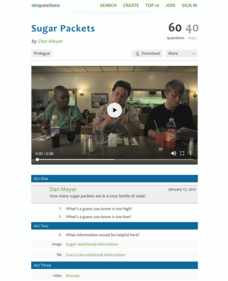
Sugar Packets
Depending on your eating habits, you just may not want to know the answer to the inquiry-based question! The task is to determine the number of sugar packets in one 20-ounce soda. Learners use nutritional information from the sugar and...


