101 Questions
Finals Week
What energy drinks have the highest concentration of caffeine? Pupils compare five energy drinks with different amounts of caffeine and different volumes. They must solve the ratios to understand the differences. An extension compares...
101 Questions
Lucky Cow
Cutting the cheese isn't a joke. Scholars observe a wedge of cheese and must determine how to cut it in half horizontally. They apply their knowledge of sectors to determine the most accurate way to slice the cheese.
101 Questions
Double Sunglasses
If you wear two sets of sunglasses, do you get twice the darkness? Pupils explore an enlightening topic using a video and math model. They discover how to extend the topic through a sequel video and challenge question.
101 Questions
Scrambler
Unscramble a carnival mystery! Scholars observe a video of an overhead view of a carnival ride, The Scrambler. They then must determine mathematically where a specific car will stop after a certain amount of time.
101 Questions
Jam Session
Don't let the learning in your classroom get jammed up! Intrigue your scholars with an open-ended scenario to explore. A video presentation shows a challenging stretch of road that is susceptible to traffic jams. The task is to determine...
101 Questions
Super Bear
Bear with your classes as they explore unit rate and proportions using gummies! Gummy bears come in many different sizes, including a 2,250-gram super bear! The task asks learners to determine how many regular bears and how many mini...
101 Questions
Dandy Candies
Package design is an economic necessity. Young scholars assume the role in an interesting inquiry-based lesson. Given 24 cubic shaped candies to package, they must determine the arrangement that uses the least amount of cardboard to...
Howard County Schools
Exponential Decay Exploration
How can you model exponential decay? Explore different situations involving exponential decay functions and decreasing linear functions by performing activities with MandM candy, popcorn kernels, and number cubes.
Howard County Schools
Getting Paid for School
What if you were paid to attend class? What kind of payment schedule would you choose? Learn how exponential functions will eventually exceed linear functions by comparing two different payment schedules for attending class.
Howard County Schools
To Babysit or Not to Babysit?
Would you work for a penny today? Use this activity to highlight the pattern of increase in an exponential function. Scholars compare two options of being paid: one linear and one exponential. Depending on the number of days worked, they...
Howard County Schools
Planning for Prom
Make the most of your prom—with math! Pupils write and use a quadratic model to determine the optimal price of prom tickets. After determining the costs associated with the event, learners use a graph to analyze the break even point(s).
Howard County Schools
Setting the Table
How many people can fit around a table? Depends on the size of the table, right? Explore patterns to generate an equation for the number of people that can fit around a table given its size.
Howard County Schools
Generous Aunt
Witness the power of exponential growth with an activity that investigates two different savings plans. Class members create tables of values to see how and when a savings plan increasing exponentially exceeds one increasing linearly.
Howard County Schools
Maria’s Quinceañera
How long will it take to save up for a car? Classmates use linear and exponential models to see how money received during a Quinceanera will grow over time.
Howard County Schools
Discounting Tickets
A boss who can't do math? Oh, no! Young entrepreneurs use linear and exponential models to determine which discount will yield the most profit on ticket sales.
101 Questions
Red Carpet
Roll out the red carpet for an exemplary lesson. Using the dimensions of a rolled piece of carpet, learners calculate the dimensions of the flat sample. Pictures provide individuals with the information they need to make a valid conclusion.
101 Questions
Best Midpoint
Develop a strong understanding of what it means to be a midpoint. Learners analyze the angles, coordinates, and lengths of segments and their approximated midpoints. They use their analyses to develop a formula to rank four attempts at...
101 Questions
Best Square
If you're a square, be the best square you can be! Young scholars develop a formula to determine the four points that make the best square that considers the area, perimeter, and other dimensions. They use their formulas to rank attempts...
101 Questions
Water Tank Filling
Grab your classes' attention with a video presentation of a problem to solve. Young scholars develop a plan to predict the time it takes to fill a tank with water. Video footage provides the statistics they need to make their conclusions.
101 Questions
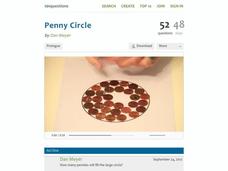
Penny Circle
Watch as your classes buy into a rich lesson full of information. A video opener challenges individuals to determine the number of pennies that fit in a circle with a 22-inch diameter. Using lesson materials, scholars collect data and...
101 Questions
Trashketball
Take a shot using a lesson on volume! Young learners watch a video showing a trashcan filling with paper balls. The task is to calculate the number of paper balls that will fit in the can. Pupils use volume calculations to make a...
101 Questions
Toothpicks
Analyze patterns and build functions. Young scholars work on their modeling skills with an inquiry-based lesson. After watching a video presentation of the problem, they write functions and make predictions.
101 Questions
The Biggest Loser
Sometimes losing is actually winning! Learners use a proportional analysis to compare percent weight loss of contestants on The Biggest Loser. The resource provides data and clips from the show to facilitate the lesson.
101 Questions
Deodorant
Smells like learning! Young scholars collect data on the length of time a stick of deodorant lasts. After modeling the data with a graph and function, they make predictions about deodorant use over time.


