GeoGebra
Too Big, or Not Too Big
Determine whether the point is just right. The interactive allows participants to input a constraint equation. Pupils pick a point and determine whether it is too big, not too big, or just right for the constraint. Using the graphing...
GeoGebra
More Ferris Wheels
Take a ride on a Ferris wheel. Using sliders to adjust the parameters of a Ferris wheel, pupils investigate the height of a point over time. The interactive traces out the curve on a time-height graph. Learners use what they learned to...
Indiana Department of Education
The Represented World: Communication—Packaging
Challenge your classes to design and market a new product. Collaborative groups use geometry skills to create packaging for their products. Finally, they plan a marketing strategy to present to a marketing specialist.
NOAA
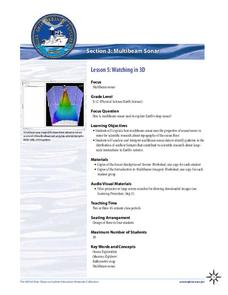
Watching in 3D
Bring the ocean floor to life! Earth science scholars discover the process of deep sea mapping in the third installment in a series of five lessons about ocean exploration. The teacher's guide includes helpful resources, worksheets, and...
NOAA
A Day in the Life of an Ocean Explorer
What's life like aboard an ocean exploration vessel? Junior oceanographers examine the important role of communication in ocean research in lesson two of a five-part series from NOAA. The materials introduce the class to life on board...
Towson University
Looking Into Lactase: Structured Inquiry
Why is lactase important? Biology scholars explore enzyme function in a structured inquiry lab. The activity tasks lab groups with observing how temperature and pH affect enzyme activity, as well as determining which milk products...
Towson University
The Crucial Concentration
Which sports drink provides the best pick-me-up after the big game or grueling workout? It may not be the one you'd think! Food science is the focus in a surprising lab activity. Pupils use colorimetry to determine the amount of protein,...
CK-12 Foundation
Data Summary and Presentation: Chart for Grouping Data
Get social! Create a display of social media use for a class. Pupils use provided information about the time spent on social media to construct a histogram. Using the histogram, learners interpret the data to answer questions.
National Council of Teachers of Mathematics
Geogebra: Residuals and Linear Regression
If the line fits, use it. Using a Geogebra interactive, pupils plot points and try to find the best fit line. They assess the linear fit by analyzing residuals. A radio button allows participants to show the regression line and the...
Education Development Center
Distance, Rate, and Time—Walking Home
Dig into a classic math problem with your classes. Through an engaging task, learners work with rate and distance information to make conclusions. In the task, two people walk at different rates; one leaves first, and scholars calculate...
CK-12 Foundation
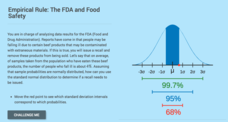
Computing Probabilities for the Standard Normal Distribution: The FDA and Food Safety
To recall or not to recall, that is the question. Using provided data, pupils calculate the percent of people that may fall ill on average. The scholars determine the standard deviation based upon the mean and the empirical rule, then...
CK-12 Foundation
Numerical Computations: Counting Out Probability
Keep your heads up while counting. Pupils use an interactive to create a table with the possible outcomes of flipping three coins and then determine the probabilities of getting certain combinations of heads and tails.
Education Development Center
Integer Combinations—Postage Stamps Problem (HS Version)
It seems the post office has run out of stamps! Learners build all the values of postage available if the post office only sells five- and seven-cent stamps. The task provides an opportunity to create an expression in two variables and...
Education Development Center
Writing Numerical Expressions—Hexagon Tables
Explore a basic pattern to practice writing expressions. In collaborative groups, learners examine a contextual pattern and write an expression to model it. The task encourages groups to describe the pattern in multiple ways.
Education Development Center
Interpreting Statistical Measures—Class Scores
Explore the effect of outliers through an analysis of mean, median, and standard deviation. Your classes examine and compare these measures for two groups. They must make sense of a group that has a higher mean but lower median compared...
CK-12 Foundation
Expected Value: Playing Darts
The expected payoff is right on target. An interactive resource provides a dart game scenario with amounts of cash prizes and probabilities of winning. Learners calculate the expected value and expected payoff for the game. To finish,...
CK-12 Foundation
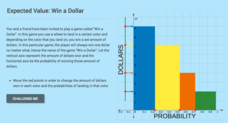
Expected Value: Win a Dollar
Spin a wheel, land on a color ... and win. Learners create a graph to display the probabilities of the amount of money they can win by spinning a colored wheel. The pupils use the dollar amounts and their probabilities to calculate the...
CK-12 Foundation
Expected Value: Game of Chance
Determine whether the payoff is worth it. Pupils calculate the expected value of a game with three different payoff levels. Each level has a different probability of winning money. The scholars find the expected payoffs for each level...
CK-12 Foundation
Expected Value: Creating a Discrete Probability Distribution Table
Wanna roll the dice? Determine whether it is a good idea to play a dice game. An interactive presents the rules for a game of dice. Pupils find the probabilities of each event and calculate the expected value of the game. They finish...
CK-12 Foundation
Geometric Probability: Dartboard
Get your class on target with probability using an exciting resource. The interactive presents three square dartboards with different target areas, which are combinations of square units. Pupils determine the probabilities of randomly...
CK-12 Foundation
Distance Between Two Polar Coordinates: Exploring Changes in Angle and Radius
Get straight answers on a curved grid. An interactive has learners apply the Law of Cosines to find the distance between two points on the polar coordinate plane. The pupils use the radii lengths and the angle between the two radii to...
Indiana Department of Education
Amusement of the Future
Take your class on the ride of their lives! Physical science scholars get an in-depth look at potential and kinetic energies in an amusement park-themed unit. Students research, design, and promote their own amusement parks, complete...
CK-12 Foundation
Translation of Vectors and Slope: Identical Vectors
Translate vectors to find equivalent ones. An interactive shows 10 randomly displayed vectors. Pupils grab the vectors and move them to group them with similar vectors in magnitude and direction. Scholars find the groups of vectors that...
CK-12 Foundation
Translation of Vectors and Slope: Rearranging a Classroom
Find out if vectors are equal in the classroom. Pupils use the interactive to create vectors showing the movements boys perform in rearranging classroom furniture. The scholars determine which boy moved furniture the farthest, or if they...


