CK-12 Foundation
Plots of Polar Coordinates: Submarine Sonar
Find the location of enemy submarines with a sonar display that doubles as a polar coordinate system. Pupils find polar coordinates that would be the same location of plotted submarines. They then determine multiple polar coordinates...
CK-12 Foundation
Trigonometric Form of Complex Numbers
Represent complex numbers in two ways. Pupils use the interactive to convert polar and rectangular representations of complex numbers. The learners drag an overlay back and forth over the coordinate plane to reveal the polar coordinates...
CK-12 Foundation
Unit Vectors and Components: Bow and Arrow
Aim for a better understanding of vector components. Scholars adjust the angle of release on a bow and determine the horizontal and vertical components of the velocity vector. The pupils finish by determining how the angle affects...
CK-12 Foundation
Determining the Equation of a Line: Trip Functions
Let the function drive the activity. The interactive displays the odometer on a car for a trip. Pupils determine and interpret the slope of the situation. Then, they find a verbal description of the equation of the function.
NASA
Resolving 2-Plane Traffic Conflicts by Changing Speed—Problem Set E
What do you do to change arrival times of airplanes when a different route is not available? The fifth interactive in a series of six presents problems where pupils must find solutions to conflicts of safety rules. They must decide how...
CK-12 Foundation
Determining the Equation of a Line: Temperature Conversion Challenge
Line up the temperature conversions. Pupils create the linear function between Celsius and Fahrenheit on a graph by plotting the freezing and boiling points of water. The scholars determine how the relationship changes based upon...
NASA
Resolving 3-Plane Traffic Conflicts by Changing Route—Problem Set C
Keep the planes from crashing. Pupils work with three airplanes and change their flight paths to keep them at a safe distance from each other. Individuals work through three problems in the third interactive in a set of six with...
NASA
Resolving 2-Plane Traffic Conflicts by Changing Route—Problem Set B
Do pilots create appropriate spacing between aircraft by traveling a longer or shorter path? An interactive presents two airplanes that violate safety protocols. Pupils must determine how to change the path of one plane to create the...
NASA
Resolving 3-Plane Traffic Conflicts by Changing Speed—Problem Set F
Get three planes to line up safely. Individuals work through a set of problems to eliminate spacing conflicts between three airplanes in flight. The pupils use their knowledge to change the airplanes' speed or route to meet a...
NASA
Understanding the Effects of Differences in Speed—Problem Set D
Fall back and slow down. The fourth lesson in a six-part series on air traffic control leads the class to find the difference in distance traveled based upon the difference in speed. Pupils work through a problem related to walking...
NASA
Introduction to Real Air Traffic Control—Problem Set A
Understand what it takes to control planes safely. The first lesson in a series of six introduces the class to the air traffic control situation. The pupils develop their understanding of units used in air travel, then learn how to read...
CK-12 Foundation
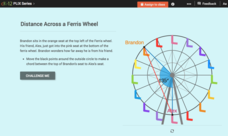
Length of a Chord: Distance Across a Ferris Wheel
An interactive presents two friends on a ferris wheel with the task of finding the distance between the them. Pupils create the chord between the two friends and calculate its lengths using trigonometric ratios.
EngageNY
Describing the Center of a Distribution Using the Median
Find the point that splits the data. The instructional activity presents to scholars the definition of the median through a teacher-led discussion. The pupils use data lists and dot plots to determine the median in sets with even and odd...
EngageNY
Writing and Graphing Inequalities in Real-World Problems
Inequalities: when one solution just doesn't suffice. Individuals learn to write inequalities in real-world contexts and graph solution sets on the number line. All inequalities in the lesson are of the form x < c or x < c.
EngageNY
Summarizing a Data Distribution by Describing Center, Variability, and Shape
Put those numbers to work by completing a statistical study! Pupils finish the last two steps in a statistical study by summarizing data with displays and numerical summaries. Individuals use the summaries to answer the statistical...
EngageNY
Describing Center, Variability, and Shape of a Data Distribution from a Graphical Representation
What is the typical length of a yellow perch? Pupils analyze a histogram of lengths for a sample of yellow perch from the Great Lakes. They determine which measures of center and variability are best to use based upon the shape of the...
EngageNY
Developing a Statistical Project
The 17th lesson in a unit of 22 presents asks the class to conduct a statistics project. Pupils review the first two steps of the process of asking a question and collecting data. They then begin the process by developing a statistical...
EngageNY
Describing Distributions Using the Mean and MAD
What city has the most consistent temperatures? Pupils use the mean and mean absolute deviation to describe various data sets including the average temperature in several cities. The 10th lesson in the 22-part series asks learners to...
EngageNY
Variability in a Data Distribution
Scholars investigate the spread of associated data sets by comparing the data sets to determine which has a greater variability. Individuals then interpret the mean as the typical value based upon the variability.
EngageNY
The Mean as a Balance Point
It's a balancing act! Pupils balance pennies on a ruler to create a physical representation of a dot plot. The scholars then find the distances of the data points from the balance point, the mean.
EngageNY
Describing the Center of a Distribution Using the Mean
Everyone does their fair share. The sixth segment in a 22-part unit presents the mean as a fair share. Groups build a conceptual understanding of the mean of a data set, rather than simply learn an algorithm. Learners use the...
EngageNY
Creating a Histogram
Display data over a larger interval. The fourth segment in a 22-part unit introduces histograms and plotting data within intervals to the class. Pupils create frequency tables with predefined intervals to build histograms. They describe...
EngageNY
Creating a Dot Plot
Which dot am I? Pupils create dot plots to represent sample data through the use of frequency tables. The third segment in a series of 22 asks individuals to analyze the dot plots they created. The scholars translate back and forth...
California Education Partners
Speedy Texting
Model the effects of practice on texting speed. Pupils develop a linear equation that models the change in texting speed based on the amount of practice. The sixth performance task in an eight-part series requires learners to solve and...


