National Security Agency
Multiple Representations of Limits
After an introductory activity to demonstrate the theory of a limit, additional activities approach a limit from graphical, numerical, and algebraic methods. The activity looks at the multiple ways of understanding and evaluating a limit.
Project Maths
Complex Number Operations
What do animated videos have to do with mathematics? Using operations of complex numbers and their representations on the complex plane, high schoolers observe how mathematics could be used to move animations. The lesson provides an...
EngageNY
Relationships Between Two Numerical Variables
Is there another way to view whether the data is linear or not? Class members work alone and in pairs to create scatter plots in order to determine whether there is a linear pattern or not. The exit ticket provides a quick way to...
EngageNY
Relationships Between Two Numerical Variables
Working in small groups and in pairs, classmates build an understanding of what types of relationships can be used to model individual scatter plots. The nonlinear scatter plots in this lesson on relationships between two numerical...
EngageNY
More on Modeling Relationships with a Line
How do you create a residual plot? Work as a class and in small groups through the activity in order to learn how to build a residual plot. The activity builds upon previous learning on calculating residuals and serves as a precursor to...
EngageNY
Modeling Relationships with a Line
What linear equation will fit this data, and how close is it? Through discussion and partner work, young mathematicians learn the procedure to determine a regression line in order to make predictions from the data.
EngageNY
Interpreting Residuals from a Line
What does an animal's gestation period have to do with its longevity? Use residuals to determine the prediction errors based upon a least-square regression line. This second lesson on residuals shows how to use residuals to create a...
Math Learning Center
Grade 1 Supplement Set A5 – Number and Operations: Place Value
First graders work together to sort, categorize, and order collections of objects through activities that help build number sense.
EngageNY
Describing the Center of a Distribution
So the mean is not always the best center? By working through this exploratory activity, the class comes to realize that depending upon the shape of a distribution, different centers should be chosen. Learners continue to explore the...
EngageNY
Estimating Centers and Interpreting the Mean as a Balance Point
How do you balance a set of data? Using a ruler and some coins, learners determine whether the balance point is always in the middle. Through class and small group discussions, they find that the mean is the the best estimate of the...
EngageNY
Conditional Relative Frequencies and Association
It is all relative, or is it all conditional? Using an exploration method, the class determines whether there is an association between gender and superpower wish through the use of calculating conditional relative frequencies. The last...
Fredonia State University of New York
Watch Your Step…You May Collide!
Can two lines intersect at more than one point? Using yarn, create two lines on the floor of the classroom to find out. Cooperative groups work through the process of solving systems of equations using task cards and three different...
Henrico County Public Schools
Solving Systems of Equations by Elimination
Eliminate the obvious. A series of slides presents algebra classes with step-by-step procedures for solving systems of equations using the elimination method. It provides an introduction to the elimination method for solving linear...
National Security Agency
Starting a Restaurant
Through an engaging unit, chefs-in-training will sort and classify data using tally charts. Learners will also create bar graphs to display restaurant data and interpret data from bar graphs using a variety of categories. This is a fun...
Math Drills
Santa's List Sums (F2)
Help Santa find the sum of the boys and girls that live on each street.
Learner
Solid Shapes
A collection of two lessons, kindergartners will identify two-dimensional shapes in solid shapes. They will develop basic knowledge of the components that make up a sphere, rectangular prism, pyramid, cylinder, cone, and cube. Young...
World Wildlife Fund
Graphs and Charts
A two-part worksheet incorporating bar graphs and pie charts, young mathematicians can practice their graphing skills. Pupils answer questions using graphs and charts but are also challenged to create their own using a given set of data.
Virginia Department of Education
Practical Problems Involving Decimals
After discussing decimals and "going shopping" in the classroom, young mathematicians are given four practical word problems that require them to estimate their answers, given specific information. The highlight of the lesson is having...
Curated OER
Susan's Choice
Young economists explore opportunity cost by counting how much money Susan has in her piggy bank. From here, they are challenged to help Susan make a choice about what she can buy with her money.
National External Diploma Program Council
Finding an Average
Young hopefuls can practice finding the average of a group of numbers represented in tables and word problems.
Doing Maths
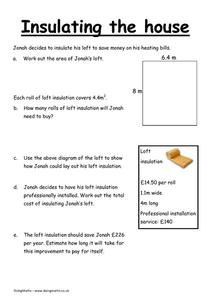
Insulating the House
Finding the area of a rectangle is the focus of this metric learning exercise. Here, mathematicians use their knowledge of finding the area of a shape in meters to discover how much material can fit inside a shape.
Old Dominion University
Introduction to Calculus
This heady calculus text covers the subjects of differential and integral calculus with rigorous detail, culminating in a chapter of physics and engineering applications. A particular emphasis on classic proof meshes with modern graphs,...
Schoolcraft College
Trigonometry
This trigonometry textbook takes the learner from a basic understanding of angles and triangles through the use of polar coordinates on the complex plane. Written by a mathematician-engineer, examples and problems here are used to...
Benjamin Franklin High School
Saxon Math: Algebra 2 (Section 9)
Section 9 of the 12 linked Saxon Math sections introduces the young algebrist to graphing periodic functions, creating graphs from quadratic roots, working with inequalities, and rational equations. Common among all the lessons is the...


