EngageNY
TASC Transition Curriculum: Workshop 8
Lights, camera, action! Math educators consider how to improve their instruction by examining a model of the five-practice problem-solving model involving a movie theater. Participants examine cognitive demand in relation to problem...
101 Questions
Blocks
Block play can teach children about gravity, physics, and spatial relationships. A hands-on lesson incorporates these concepts with an activity in which learners examine the relationship between levels in a pile. Scholars begin to...
Howard County Schools
Drawing Inverses
An Algebra II instructional activity draws the connection between the exponential function and its inverse. By graphing an exponential function and using tables and a calculator, high schoolers graph the logarithmic function. The plan...
Howard County Schools
Building a Playground
Scholars crave practical application. Let them use the different models of a quadratic function to plan the size and shape of a school playground. They convert between the different forms and maximize area.
Howard County Schools
Planning for Prom
Make the most of your prom—with math! Pupils write and use a quadratic model to determine the optimal price of prom tickets. After determining the costs associated with the event, learners use a graph to analyze the break even point(s).
Howard County Schools
Generous Aunt
Witness the power of exponential growth with an activity that investigates two different savings plans. Class members create tables of values to see how and when a savings plan increasing exponentially exceeds one increasing linearly.
101 Questions
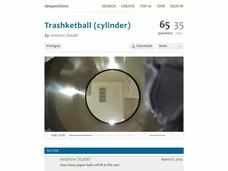
Trashketball
Take a shot using a lesson on volume! Young learners watch a video showing a trashcan filling with paper balls. The task is to calculate the number of paper balls that will fit in the can. Pupils use volume calculations to make a...
National Council of Teachers of Mathematics
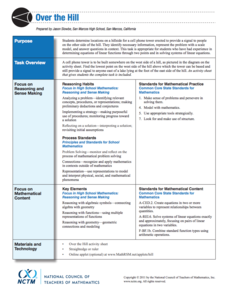
Over the Hill
Can you hear me from there? Pupils determine the place to build a cell tower on a hill. The class uses constraints and creates a scale drawing on a coordinate system to calculate the exact location of the base of the cell tower.
National Council of Teachers of Mathematics
Cash or Gas?
Which option provides the best payout? Pupils predict which lottery prize to take. They devise a method to calculate which prize would likely provide the greatest monetary value.
National Council of Teachers of Mathematics
Eruptions: Old Faithful Geyser
How long do we have to wait? Given several days of times between eruptions of Old Faithful, learners create a graphical representation for two days. Groups combine their data to determine an appropriate wait time between eruptions.
Alabama Learning Exchange
Building Functions: Reverse to Inverse
Reverse the wrapping to get to the gift. Using the idea of unwrapping a gift, the lesson introduces the concept of inverses. Pupils first determine the order needed to evaluate a function at a point, then use the reverse to find the...
Mathematics Assessment Project
Representing Quadratic Functions Graphically
Sometimes being different is an advantage. An engaging activity has scholars match cards with quadratic functions in various forms. Along the way, they learn about how each form highlights key features of quadratic functions.
Beyond Benign
Got Gas
How much gas does it take to drive around town? The class uses a variety of mathematical procedures to take a look at the use of gas for transportation. Class members use a different unit to determine the cost of driving a car as opposed...
Beyond Benign
Can You Hear Me Now? Cell Phone Accounts
How sustainable are cell phones? Throughout the unit, learners explore the issues around cell phones concerning sustainability. Class members take a graphical look at the number of cell phones across the world using a box-and-whisker...
Beyond Benign
Municipal Waste Generation
Statistically, waste may become a problem in the future if people do not take action. Using their knowledge of statistics and data representation, pupils take a look at the idea of waste generation. The four-part unit has class members...
GeoGebra
Getting on the Right Wavelength
Predict an equation that waves up and down. Pupils set the height, radius, and period of a Ferris wheel. The learners write a sine equation to match the graph of the height of a point on the wheel as a function of time. Running the...
GeoGebra
Yardwork in Segments
Stretch your knowledge of ratios to the coordinate plane. The interactive allows pupils to set the endpoints of a directed line segment and form a right triangle. Using rubber bands, users visualize the line segment divided into equal...
GeoGebra
All For One, One For All
Will someone please constrain those pets? Pupils create two constraint equations on the number of cats and dogs for a pet sitter. They choose specific points and determine whether the point satisfies one or both constraints. The...
CK-12 Foundation
Variance of a Data Set
Use variable value sliders to understand variance. The interactive shows four whole numbers, their mean and deviation. Using the information, pupils find the variance of the numbers and respond to question related to the understanding of...
GeoGebra
Triangle Dilations
Stretch the class' knowledge of dilations. With the aid of the rubber band stretcher tool, learners perform dilations. They dilate the triangle by a whole number scale and a fractional scale from two centers of dilation.
GeoGebra
Pet Sitters Feasible Region
Find the best way to maximize the profit. Pupils graph four constraints of a pet-sitting company, using a revenue equation to find a maximum amount the sitters can earn. By using the equation, scholars determine the number of cats and...
GeoGebra
Conjectures and Proof
Transform proofs using triangle rotations. By rotating a triangle around various points, class members develop proofs. Participants prove relationships of alternative interior angles formed by parallel lines and the sum of the interior...
GeoGebra
More Ferris Wheels
Take a ride on a Ferris wheel. Using sliders to adjust the parameters of a Ferris wheel, pupils investigate the height of a point over time. The interactive traces out the curve on a time-height graph. Learners use what they learned to...
GeoGebra
Leaping Lizards
Transform lizards onto different locations. The interactive provides a diagram of a lizard and several locations. Pupils use their knowledge of transformations to move the lizard to the different locations and use the tools of GeoGebra...


