Curated OER
Systems of Equations
Texas Instruments and Glencoe/McGraw-Hill have put together a full lesson to help you instruct your math class. Using the textbook, a TI-83 calculator, and attached the PDF learners will solve systems of equations and state decimal...
Ohio Department of Education
The Solution is Complex
Consider complex numbers, roots, and quadratic equations. Use the discriminate as a way to determine the nature of a quadratic's roots. Then discuss the similarities and differences between quadratics with two, one, or no real roots....
Curated OER
Proof of Identity
Students explore trigonometric identities. In this Algebra II lesson, students use graphing to verify the reciprocal identities. Using Cabri Jr, students investigate the Pythagorean trigonometric identities and the geometric c proofs...
Primary Resources
Fraction Word Problems
Five fraction word problems using addition are included in this worksheet. Four of the problems revolve around food: pizza, cakes, bread, and pies! Tip: For extra fun, bring in a real loaf of bread, or other food item, to demonstrate one...
Curated OER
Curve Ball
Create a Height-Time plot of a bouncing ball using a graphing calculator. Graph height as a function of time and identify the vertex form of a quadratic equation that is generated to describe the ball's motion. Finally, answer questions...
Computer Science Unplugged
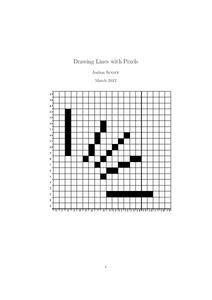
Drawing Lines with Pixels
How do the computers keep it straight? Using the provided algorithms, class members draw a line and a circle using pixels. They then check the drawings using a straight edge and compass to determine the accuracy of their drawings.
Math Worksheets Land
Patterns of Association (Using Data Tables) - Independent Practice Worksheet
Here is a worksheet that belongs in a four-part resource that has learners practice using data tables to calculate percentages. The page has ten problems with different data tables asking to find different percents.
Math Worksheets Land
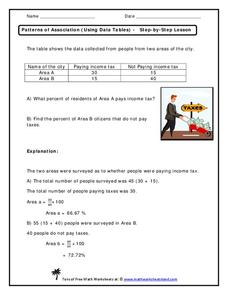
Patterns of Association (Using Data Tables) - Step-by-Step Lesson
This worksheet belongs to a four-part resource that gathers information from data tables to calculate percentages. The page introduces one problem and shares an explanation to the answer.
WindWise Education
What Factors Influence Offshore Wind?
What is that out in the water on the horizon? Teams work together to study the coastline using maps to determine the best and worst locations to place an offshore wind farm. The teams then build a scale model wind farm to see what it...
Curated OER
Geometric Pictures of One Half
A learning task that involves creative ways of thinking permits children to use paper models as a way to visualize the fraction one-half. Learners can fold or cut their models in such a way that the unshaded regions, and shaded regions...
Curated OER
Domino Addition
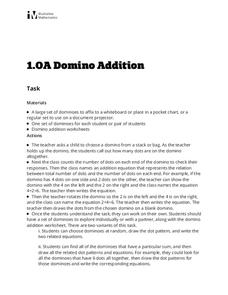
Hands-on learning in math is essential to all learners, especially youngsters. In a math learning activity, young mathematicians use dominoes in order to discover the commutative property of addition. Fact families and doubles facts can...
K-5 Math Teaching Resources
Angles Template
Young mathematicians learn to see geometry from different angles with this simple printable resource. Providing multiple visual examples of angles, this simple document can be used as an instructional tool, a skills practice exercise, or...
Georgia Department of Education
The Basketball Star
Have learners use math to prove they are sports stars! Assess a pupil's ability to create and analyze data using a variety of graphs. The class will be motivated by the association of math and basketball data.
NSW Department of Education
Relationships Between Formal Measurement Units: Measure and Record Mass in Kilograms and Grams
Teach the masses about the metric system with this hands-on measurement lesson. Given a fruit or vegetable, learners estimate, measure, and convert its mass using the metric units gram and kilogram.
Texas Instruments
Classifying Functions
Learners explore linear, quadratic, and exponential functions in this activity that makes use of TI Navigator and TI Plus calculators. Using the technology, learners compare and contrast the three types of functions given in the activity.
Carroll Country Public Schools
Ten Frame Practice
Ten-frames are great visual tools that support the development of number sense in young mathematicians. A multitude of ten-frames are included in this slide show that provide learners with practice with quickly and fluently identifying...
Curated OER
Data Analysis, Probability, and Discrete Math
Choose to supplement your probability unit with this resource and you won't be disappointed with the outcome. Teach young mathematicians to organize information using tree diagrams and lists in order to determine the possible outcomes of...
Illustrative Mathematics
Graphs of Compositions
It might help when working with this resource to give an example of a composition function. For example, the amount of time it takes to get to work depends on the amount of traffic; the amount traffic depends on the time of day....
Illustrative Mathematics
Tides
A very simple example of a functional relationship between depth of water and time is shown here. In fact, it might be more useful to use a coastal tide book to better illustrate this real-world experience. Pupils are to count the number...
Illustrative Mathematics
Baseball Cards
Here is a resource that demonstrates growth and the initial state of an equation. In this case, your class will be looking at baseball collections. How many baseball cards did the collector start out with, and how many were added or...
National Research Center for Career and Technical Education
Health Science: Back to Basics
This lesson focuses on unit conversion, proportions, ratios, exponents, and the metric system. Discuss measurement with your math class and demonstrate how to solve several health-science word problems. Give learners a chance to visit an...
Illustrative Mathematics
Biggest Number Wins
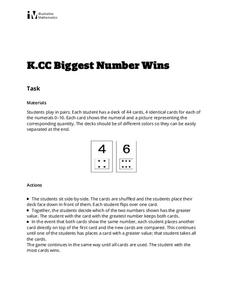
Engage your mathematicians with this simple number-quantity game. Working in pairs, using two decks of 44 cards numbered 0-10 with corresponding sets of objects or images, young learners will each flip a card and decide which number is...
Illustrative Mathematics
Springboard Dive
Dive into this problem that illustrates a real-world application of the quadratic formula. Learners are given an equation that represents the height of a diver above the water t seconds after leaving the springboard. The task is to...
Illustrative Mathematics
Graphs of Power Functions
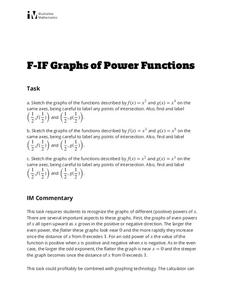
This activity consists of three exercises in which learners sketch the graphs of various power functions on the same axes. They use their sketches to make comparisons and observations which lead to generalizations about the graphs of...


