ReadWriteThink
Read Write Think: Venn Diagram Rubric
A printable three-leveled rubric for evaluating a Venn diagram in the areas of test support of comparisons, placement of statements, and number of quality statements. Directions on how to use this rubric as well as lists of teaching...
University of Cambridge
University of Cambridge: Maths and Sports: Our Sports
What events are there in your school sports day, and in the Olympic Games? What are your favourite races and sports? This activity encourages discussion and decisions about how to collect and display data, and is designed to be...
University of Cambridge
University of Cambridge: Maths and Sports: The Games' Medals
Who could have won the gold, silver and bronze medals? This activity is designed to be accessible to primary pupils at Key Stage 1.
Khan Academy
Khan Academy: Solve Problems With Bar Graphs 1
Read and interpret bar graphs. Students receive immediate feedback and have the opportunity to try questions repeatedly, watch a video or receive hints.
Read Works
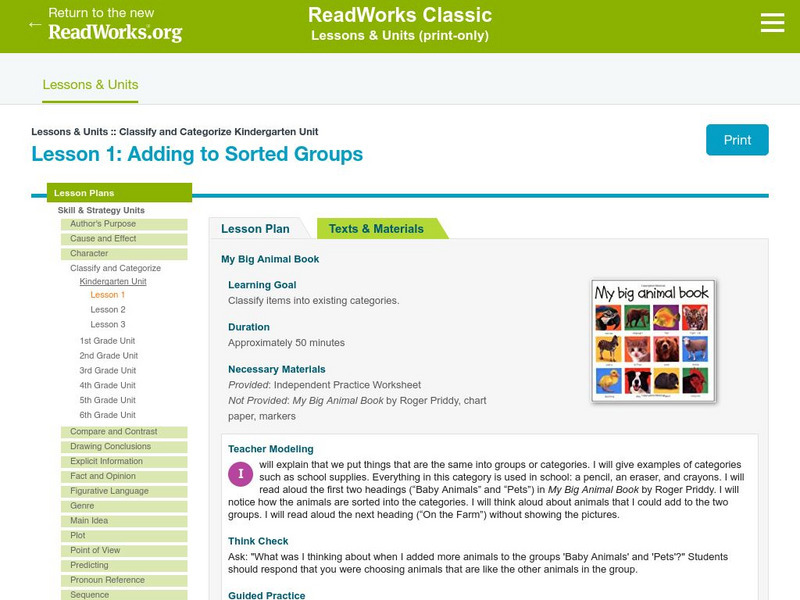
Read Works: Classify and Categorize Kindergarten Unit: Adding to Sorted Groups
[Free Registration/Login Required] A lesson using the book My Big Animal Book by Roger Priddy in which students learn to sort items into predetermined categories. Ideas for teaching, guided practice, and independent practice are...
University of Cambridge
University of Cambridge: Maths and Sports: Match the Matches
Decide which charts and graphs represent the number of goals two football teams scored in fifteen matches. This data handling activity is designed to get children talking meaningfully about mathematics, presenting and justifying...
Illustrative Mathematics
Illustrative Mathematics: Finding Equal Groups
This activity will test how quickly young scholars can count objects. The teacher will assemble a variety of groups of objects in a few different forms (examples included). Students will race against the clock to sort the groups of...
Illustrative Mathematics
Illustrative Mathematics: Favorite Ice Cream Flavor
The purpose of this task is for students to represent and interpret categorical data. As a class, students will answer a question with three possible answers and construct a bar graph with the responses. Multiple discussion questions and...
Illustrative Mathematics
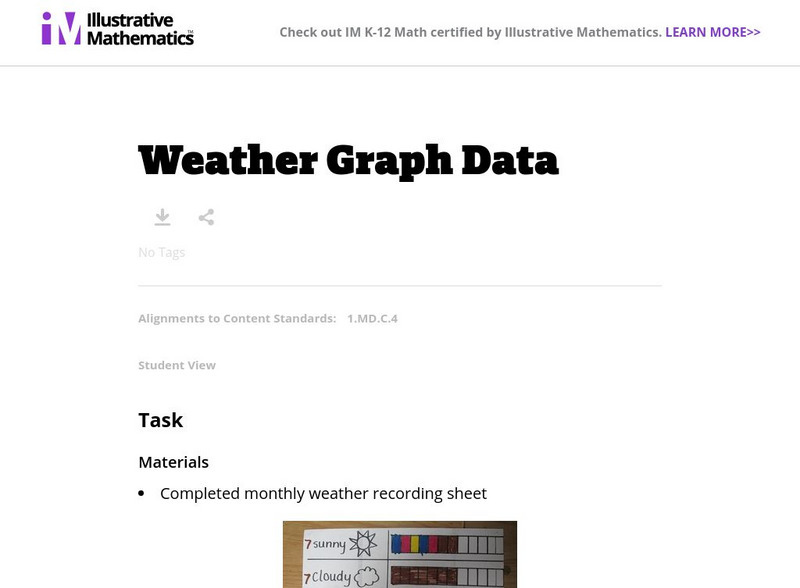
Illustrative Mathematics: Weather Graph Data
The purpose of this task is for students to represent and interpret weather data, as well as answer questions about the data they have recorded. Student worksheets and recording sheet are included.
Alabama Learning Exchange
Alex: It's Automatic! More or Less With Ten
In this lesson, students will observe patterns with the use of a Hundreds Chart, web-based practice (IXL Hundreds Chart Practice), and by playing a game (10 More or 10 Less). The patterns noticed through the various activities will help...
Alabama Learning Exchange
Alex: Count Your Raisins
In this instructional activity students will create a class line plot using data collected from boxes of raisins. This activity will be used to collect, organize, represent, and describe data using the line plot.
Better Lesson
Better Lesson: Graphing January's Weather
First graders graph the weather in Vermont for the month of January.
Better Lesson
Better Lesson: Graph Party
First graders will be involved in creating three different types of graphs and then be asked to answer questions about each representations data set.
Better Lesson
Better Lesson: What Is Your Favorite Pet?
SWBAT create a bar graph to match a data set. SWBAT analyze the graph to find 3 pieces of information the graph shows them.
Better Lesson
Better Lesson: What Is Your Favorite Little Bear Story?
SWBAT create a bar graph to match a data set. SWBAT analyze the graph for 3 pieces of information.
Better Lesson
Better Lesson: What Playground Toy Should the Principal Buy for Us
SWBAT use a graph as evidence in a persuasive letter. SWBAT evaluate statements to determine which statement is true, citing evidence in the graph.
Better Lesson
Better Lesson: What Is Your Favorite Snack?
SWBAT use graphs to analyze whether a statement is true or false. SWBAT use graphs as evidence for a persuasive letter.
Better Lesson
Better Lesson: Counting Collections: 100 Objects
First graders work to count to 100 in this rigorous counting activity. Students create a shape out of their 100 objects for a creative twist. This lesson contains a detailed plan, video explanation, discussion questions based on ability...
Better Lesson
Better Lesson: Counting Collections
This is a super fun instructional activity for letting kids get their hands busy, while also building crucial number sense! In this instructional activity, students share strategies for counting collections of objects. This instructional...
Better Lesson
Better Lesson: Using Table Data: Time to the 1/2 Hour
My students have learned how to read and write time. Now I want them to see how important time is for us to organize our lives. I want them to use data charts for schedules and be able to analyze the information.
Better Lesson
Better Lesson: Making a Table
First graders get a chance to use tables when breaking a total quantity into its component parts.
Better Lesson
Better Lesson: Would You Rather Be a Kid or a Grown Up?
Would you rather be a kid or a grown up? This question interests students and engages them in an interesting graphing exercise focused on how many total data points there are in a graph.
Better Lesson
Better Lesson: Survey Skills: Assessment
Today we become Gallup Poll central as students take a set of collected data and create a visual representation using the skills that have been taught over the past few lessons.


