Beacon Learning Center
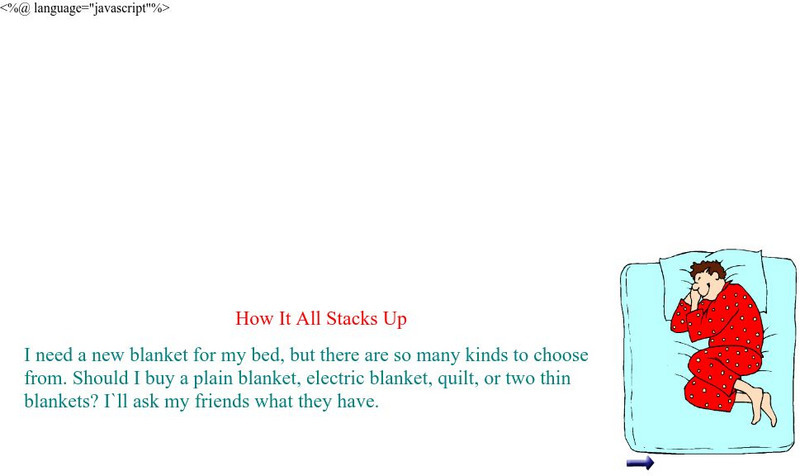
Beacon Learning Center: How It All Stacks Up
The resource examines how to use bar graphs to organize and display data.
Beacon Learning Center
Beacon Learning Center: Play Ball
An interactive web lesson shows examples of pictographs and challenges students to answer questions about the graphs.
ABCya
Ab Cya: Fuzz Bugs Graphing
Students drag the fuzz bugs into the correct container to create a bar graph that is used to compare data.
TeacherLED
Teacher Led Interactive Whiteboard Resource Survey
Students can explore surveys, pie charts, and bar graphs with this interactive white board resource.
Khan Academy
Khan Academy: Solve Problems With Bar Graphs 1
Read and interpret bar graphs. Students receive immediate feedback and have the opportunity to try questions repeatedly, watch a video or receive hints.
Khan Academy
Khan Academy: Make Bar Graphs 1
Practice creating bar graphs (bar charts) from data sets. Students receive immediate feedback and have the opportunity to try questions repeatedly, watch a video or receive hints.
Math Is Fun
Math Is Fun: Pictographs
Explains, with examples, what pictographs are and their limitations. Includes ideas for making a pictograph and a set of practice questions.
Khan Academy
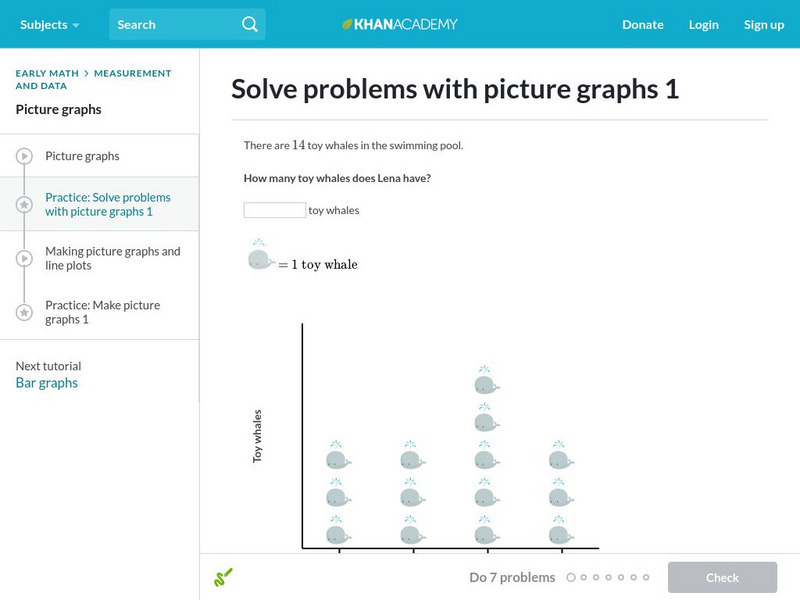
Khan Academy: Solve Problems With Picture Graphs 1
Read and interpret picture graphs. Students receive immediate feedback and have the opportunity to try questions repeatedly, watch a tutorial video, or receive hints.
Oswego City School District
Regents Exam Prep Center: Working With Sets and Venn Diagrams
A collection of activities that help students understand number relationships by using Venn diagrams to solve math problems. Practice problem solving skills in the interactive practice. Then, follow up with a classroom activity using the...
University of Cambridge
University of Cambridge: Maths and Sports: Match the Matches
Decide which charts and graphs represent the number of goals two football teams scored in fifteen matches. This data handling activity is designed to get children talking meaningfully about mathematics, presenting and justifying...
Khan Academy
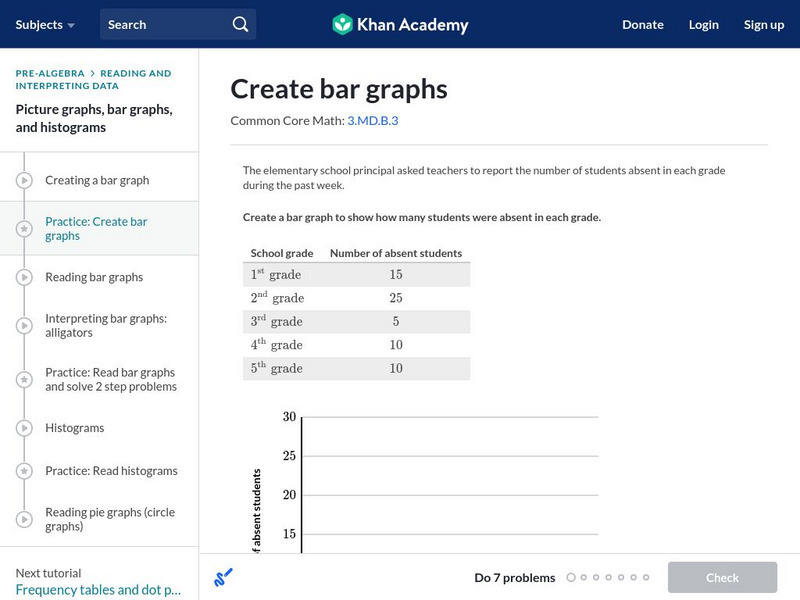
Khan Academy: Create Bar Graphs
Create a bar graph with the data given. Students receive immediate feedback and have the opportunity to try questions repeatedly, watch a video tutorial, or receive hints about creating bar graphs. CCSS.Math.Content.3.MD.B.3 Draw a...
Khan Academy
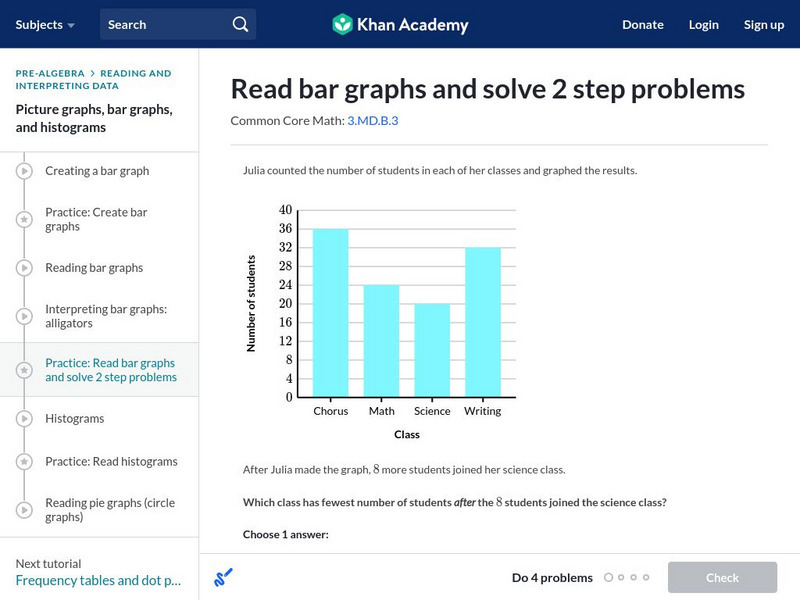
Khan Academy: Read Bar Graphs and Solve 2 Step Problems
Read and interpret a double bar graphs. Students receive immediate feedback and have the opportunity to try questions repeatedly, watch a video or receive hints. CCSS.Math.Content.3.MD.B.3 Draw a scaled picture graph and a scaled bar...
Khan Academy
Khan Academy: Read Picture Graphs (Multi Step Problems)
Interpret picture graphs to answer questions about a context. Students receive immediate feedback and have the opportunity to try questions repeatedly, watch a video or receive hints.
Khan Academy
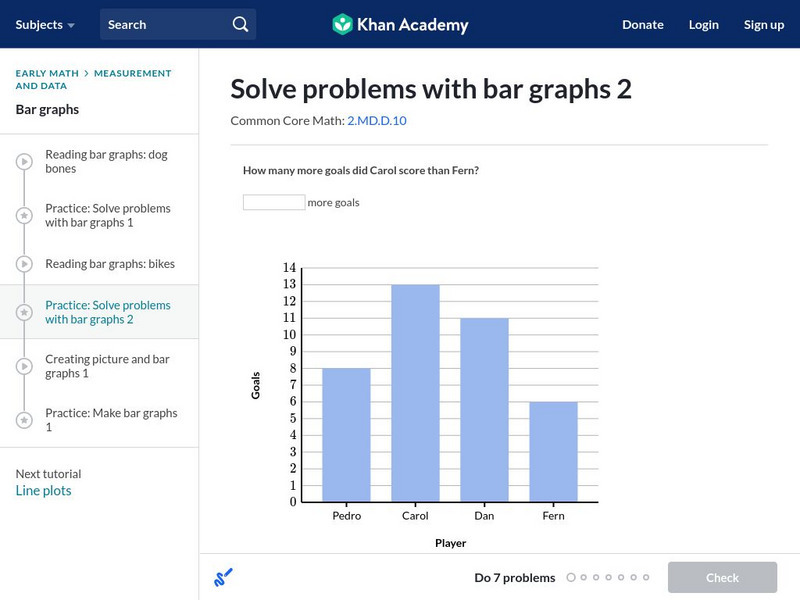
Khan Academy: Solving Problems With Bar Graphs 2
In this exercise, students practice solving problems with bar graphs. Students receive immediate feedback and have the opportunity to get hints, watch a tutorial video, and try questions repeatedly.
Khan Academy
Khan Academy: Make Bar Graphs 1
A practice quiz where students construct bar graphs using the given information. Includes hints.
Khan Academy
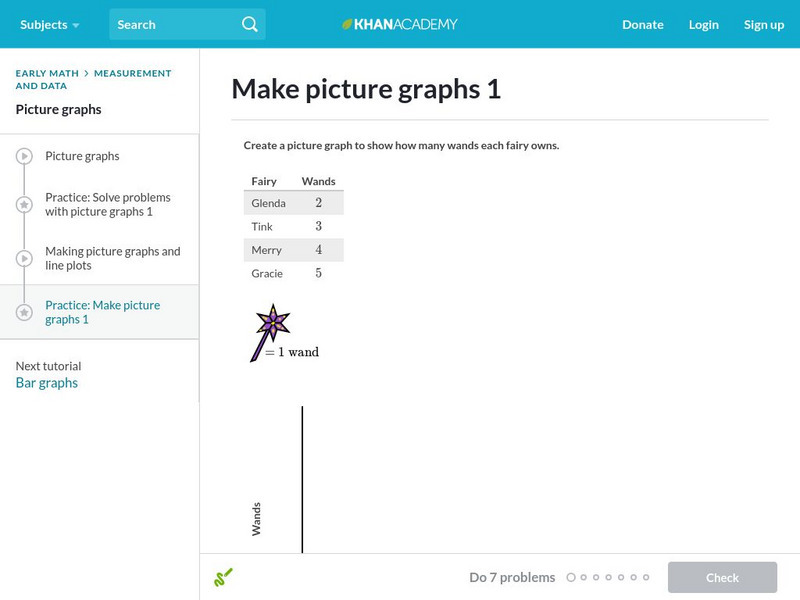
Khan Academy: Make Picture Graphs 1
A practice quiz where students construct the pictographs described in the problems. Includes hints.
Khan Academy
Khan Academy: Practice: Solve Problems With Picture Graphs
A practice quiz where students solve the problems by studying the pictographs. Includes hints.
Khan Academy
Khan Academy: Solve Problems With Bar Graphs 2
Use bar graphs to solve addition and subtraction word problems. Students receive immediate feedback and have the opportunity to try questions repeatedly, watch a tutorial video, or receive hints.
Success Link
Success Link: Fruit Loops Graphs
A lesson plan on graphing for young learners that can be adapted for older elementary students too. Use Fruit Loops for providing data that can be expressed in many different graphs.
Illustrative Mathematics
Illustrative Mathematics: Favorite Ice Cream Flavor
The purpose of this task is for students to represent and interpret categorical data. As a class, students will answer a question with three possible answers and construct a bar graph with the responses. Multiple discussion questions and...
Illustrative Mathematics
Illustrative Mathematics: 3.oa, Md, Nbt Classroom Supplies
The purpose of this task is for students to solve problems involving the four operations and draw a scaled picture graph and a scaled bar graph to represent a data set with several categories. Aligns with 3.NBT.A.2;...
Khan Academy
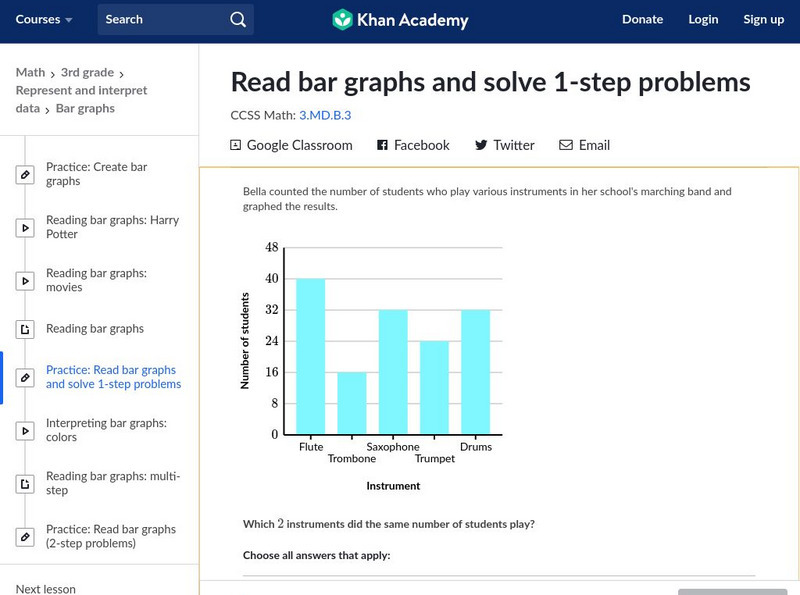
Khan Academy: Read Bar Graphs and Solve 1 Step Problems
Interpret bar graphs to answer questions about a context. Students receive immediate feedback and have the opportunity to try questions repeatedly, watch a video or receive hints.
Khan Academy
Khan Academy: Graph Data on Line Plots
Record measurements on line plots (also called dot plots). Students receive immediate feedback and have the opportunity to try questions repeatedly, watch a video or receive hints.
Khan Academy
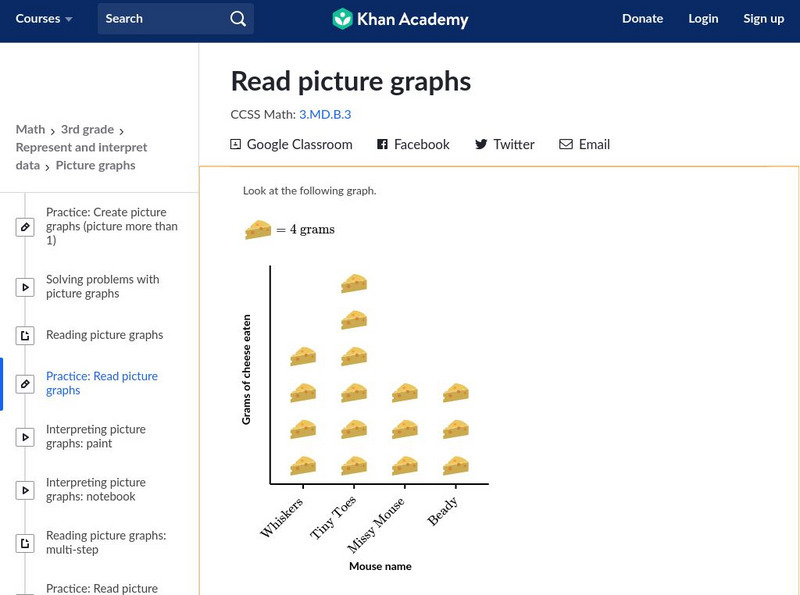
Khan Academy: Read Picture Graphs
Use picture graphs to solve word problems. Students receive immediate feedback and have the opportunity to try questions repeatedly, watch a video or receive hints. CCSS.Math.Content.3.MD.B.3 Draw a scaled picture graph and a scaled bar...


