EngageNY
Fraction Equivalence, Ordering, and Operations
Need a unit to teach fractions to fourth graders? Look no further than this well-developed and thorough set of lessons that takes teachers through all steps of planning, implementing, and assessing their lessons. Divided into eight...
National Security Agency
Are You Ready to Call the Guinness Book of Records?
Learners design questions that can be answered by collecting data. In this line-plot lesson, pupils collect data and graph on a line plot on world records. An abundant supply of teacher support is provided in this resource.
American Statistical Association
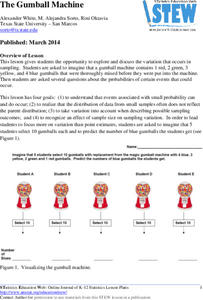
The Gumball Machine
Chew on an activity for probability. Given information on the number of gumballs in a gumball machine, scholars consider how likely it is to randomly draw a blue gumball and how many of each color they would draw in 10 trials if the...
US Department of Commerce
Featured Activity: Population Change Over Time
Keep track of a state's population. After a brief discussion on how population data is used for funding, individuals look at population changes over time. Pupils find the population of two states using three different censuses. They then...
American Statistical Association
Speedster
Catch me if you can. Scholars collect data on reaction time by catching a falling ruler or by using an Internet app. They determine the median of the data, create graphs, and analyze the results. They also compare their data to the rest...
Curated OER
Drive the Data Derby
Three days of race car design and driving through the classroom while guessing probability could be a third graders dream. Learn to record car speed, distances traveled, and statistics by using calculation ranges using the mean, median,...
Curated OER
Button Bonanza
Collections of data represented in stem and leaf plots are organized by young statisticians as they embark some math engaging activities.
Public Schools of North Carolina
Math Stars: A Problem-Solving Newsletter Grade 4
Fresh off the press, these math newsletters will challenge the problem solving skills of your young mathematicians. With an incredibly wide variety of questions covering the topics of arithmetic and geometry, these unique...
Math Moves U
Collecting and Working with Data
Add to your collection of math resources with this extensive series of data analysis worksheets. Whether your teaching how to use frequency tables and tally charts to collect and organize data, or introducing young...
National Security Agency
Line Plots: Frogs in Flight
Have a hopping good time teaching your class how to collect and graph data with this fun activity-based lesson plan series. Using the provided data taken from a frog jumping contest, children first work...
PBS
Garden Grade 6 Area and Perimeter
Engage young mathematicians in applying their knowledge of area and perimeter with a fun geometry lesson. Through a series of problem solving exercises, children use their math knowledge to design different-sized garden...
Federal Reserve Bank
Less Than Zero
Perry the penguin wants to buy a new scooter, but he doesn't have any funds! Walk your kids through the short book Less Than Zero, and have them track his borrowing, spending, and saving on a line graph while you read. Pupils will learn...
Savvas Learning
Saxon Math 5/4
You'll never have to search for another worksheet again after downloading this extensive collection of Saxon math materials. With over 600 pages of example problems and skills practice exercises, this is a must-have resource...
Michigan State University
Gases Matter
Young scientists learn that seeing isn't necessarily believing when it comes to the states of matter. After performing a fun class demonstration that models the difference between solids, liquids, and gases, children complete a series of...
Berkshire Museum
Adopt a Schoolyard Tree
Help young scientists connect with nature and learn about trees with a fun life science lesson. Heading out into the school yard, children choose a tree to adopt, taking measurements, writing descriptions, and drawing sketches of it in...
Berkshire Museum
The Three Life-Giving Sisters: Plant Cultivation and Mohican Innovation
Children gain first-hand experience with Native American agriculture while investigating the life cycle of plants with this engaging experiment. Focusing on what the natives called the Three Sisters - corn, beans, and squash - young...
Curated OER
Sun and Shadows
Why do shadows look different in the summer than in the winter? What causes day and night? How can a sundial be used to tell time? Answer these questions and more through two engaging lessons about light and shadows. Fourth and fifth...
NASA
Geographical Influences
"If global warming is real, why is it so cold?" Distinguishing the difference between weather and climate is important when it comes to understanding our planet. In these activities, young scientists look at the climate patterns in a...
California Academy of Science
California's Climate
The United States is a large country with many different climates. Graph and analyze temperature and rainfall data for Sacramento and Washington DC as you teach your class about the characteristics of Mediterranean climates. Discuss the...
Pennsylvania Department of Education
What is the Chance?
Fourth and fifth graders make predictions using data. In this analyzing data lesson, pupils use experimental data, frequency tables, and line plots to look for patterns in the data in order to determine chance. You will need to make a...
Beacon Learning Center
Line Plots
Introduce line plots, show examples of tables, graphing on a number line, and engage in a class discussion. Share the process by which statistical data is organized and displayed on a number line. Examples and worksheets are included....
Alabama Learning Exchange
How Old is Your Money?
Elementary learners explore coin mint dates. First, they listen to the book Alexander Who Used to be Rich Last Sunday by Judith Viorst. They then sort a collection of coins according to their mint date and put them in order from oldest...
PBS
Button, Button
Youngsters count, classify, and estimate quantities using buttons after a read aloud of The Button Box by Margarette S. Reid. They discuss the difference between guessing and estimating. Based on an experiment, they predict the...
Alabama Learning Exchange
Ice Cream Sundae Survey
Young scholars analyze data through graphs. They will complete a class survey on ice cream sundaes and tally and graph the responses. They then analyze the information from the class graph.


