Mangahigh
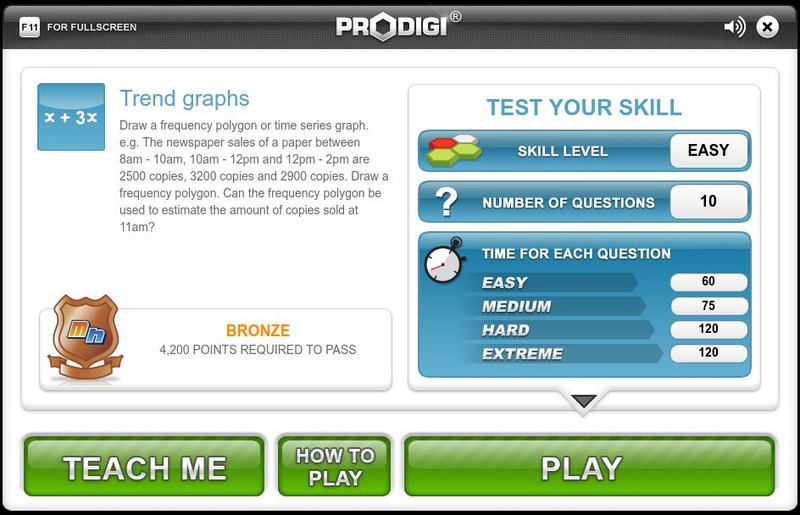
Mangahigh: Data: Trend Graphs
Students explore the concept of frequency trend graphs by working through an online tutorial and then attempting a ten question quiz that increases in difficulty as questions are answered correctly.
Mangahigh
Mangahigh: Data: Use and Interpret Pictographs
This site provides students practice with the concept of pictographs. Students can learn about the topic by completing an interactive tutorial. Students can then take a ten question timed test to practice the skill.
Mangahigh
Mangahigh: Data: Scatter Plots
This site provides students practice with the concept of scatter plots. Students can learn about the topic by completing an interactive tutorial. Students can then take a ten question timed test to practice the skill.
Mangahigh
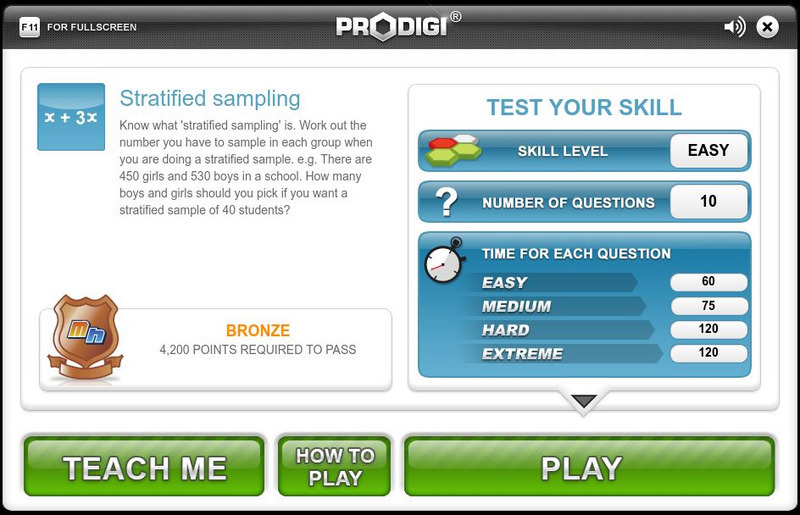
Mangahigh: Data: Stratified Sampling
This site provides students practice with the concept of stratified sampling. Students can learn about the topic by completing an interactive tutorial. Students can then take a ten question timed test to practice the skill.
Khan Academy
Khan Academy: Comparing Distributions
Practice comparing distributions that are presented in dot plots, histograms, and box plots. Students receive immediate feedback and have the opportunity to try questions repeatedly, watch a video or receive hints.
Khan Academy
Khan Academy: Interpreting Quartiles
Practice understanding the meaning of quartiles of data sets. Students receive immediate feedback and have the opportunity to try questions repeatedly, watch a video or receive hints.
Soft Schools
Soft Schools: Probability and Statistics Quiz
Students are asked to find the mean, median, mode, and range of a data set. Also, they must be able to interpret graphs and tables, and graphically represent data. The quiz is multiple choice and consists of nine questions, and a summary...
Khan Academy
Khan Academy: Statistical Questions
Practice spotting the difference between statistical and non-statistical questions. Students receive immediate feedback and have the opportunity to try questions repeatedly, watch a video or receive hints.
Khan Academy
Khan Academy: Calculating the Mean
Practice calculating the mean of a data set. Data is displayed in different forms of graphical representation.
Varsity Tutors
Varsity Tutors: Hotmath: Practice Problems: Statistics
Fifteen problems presented on the topics: mean, median, mode, outliers and graphing statistics. They are given with each step to the solution cleverly revealed one at a time. You can work each step of the problem then click the "View...
Sophia Learning
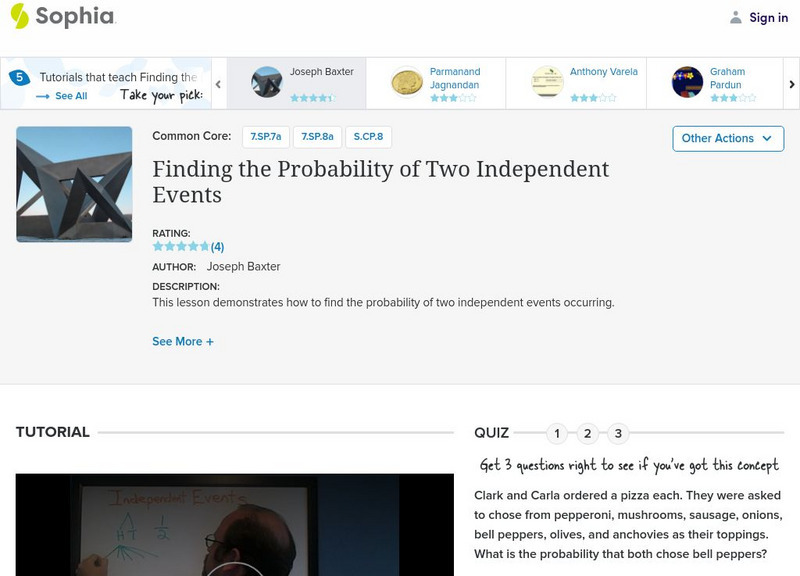
Sophia: Finding the Probability of Two Independent Events
Determine the probability of two independent events. Assess learning with a quiz.
Annenberg Foundation
Annenberg Learner: Analyzing Binomial Probabilities
A tree diagram is a helpful tool for determining theoretical or mathematical probabilities. Toss a coin and watch as branches represent a toss of either head or tails.
Shmoop University
Shmoop: Basic Statistics & Probability: Designing a Study
Presents the steps to follow in designing a study in statistics and explains what makes a good statistical question.
McGraw Hill
Glencoe Mathematics: Online Study Tools: Permutations
This site gives a short interactive quiz which allows students to self-assess their understanding of the concept of permutations.
National Council of Teachers of Mathematics
The Math Forum: Nctm: Ask Dr. Math: Stem and Leaf and Scatter Plots
This site is a question/response page which focuses on stem-and-leaf representation and how to construct scatter plots. Dr. Math works through an example and gives commentary notes. Site also contains links for more help.
National Council of Teachers of Mathematics
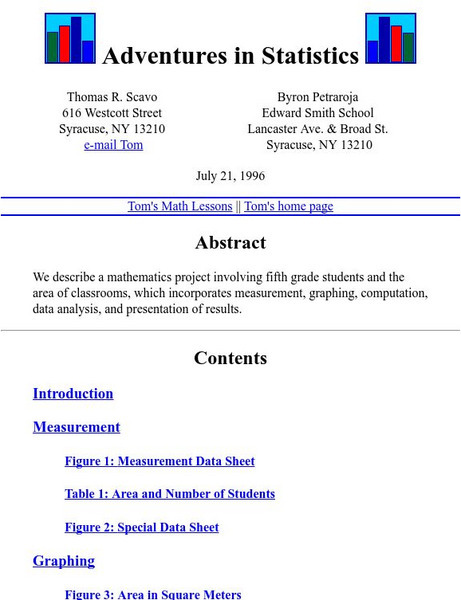
The Math Forum: Drexel Math Forum: Adventures in Statistics
This lesson incorporates problem-solving and data collection to satisfy a fifth grade class's curiosity about the size of their classroom with respect to a sixth grade classroom.
Khan Academy
Khan Academy: Statistical Questions
In this exercise, students practice solving statistical questions. Students receive immediate feedback and have the opportunity to get hints and try questions repeatedly.
Illustrative Mathematics
Illustrative Mathematics: 6.sp.1 Identifying Statistical Questions
A task asking students to determine which of the seven questions listed are statistical questions and which are not.
Illustrative Mathematics
Illustrative Mathematics: 6.sp Buttons: Statistical Questions
A task asking students to determine which of the six questions listed are statistical questions and which are not. Students are then asked to write a statistical question of their own.
ArtsNow
Arts Now Learning: The Sound of Numbers [Pdf]
In this lesson, students will explore numbers and their relationships through rhythm and learn how every aspect of music can be described mathematically. Includes a probability challenge for students.
Other
Statistics Education Web: Bubble Trouble [Pdf]
Use random sampling to formulate, collect, and compare data from two populations. Written by Peter Banwarth of Oregon State University.
Alabama Learning Exchange
Alex: Statistically Thinking
The object of this project is for students to learn how to find univariate and bivariate statistics for sets of data. Also, the students will be able to determine if two sets of data are linearly correlated and to what degree. The...
Better Lesson
Better Lesson: 100 Students Project: What if the World Were 100 People?
Sixth graders learn about statistics and the process of doing statistics as an introduction to the 100 Students Project they will conduct about themselves and their classmates.
Better Lesson
Better Lesson: Histogram Activity
Sixth graders will see how an actuary uses histograms to analyze the frequency of events to determine risk.












![Statistics Education Web: Bubble Trouble [Pdf] Lesson Plan Statistics Education Web: Bubble Trouble [Pdf] Lesson Plan](https://content.lessonplanet.com/knovation/original/715465-988c4be74f96df36c2d9bcb6f2f5182f.jpg?1661829195)
