Concord Consortium
Seeing Math: Plop It
Plop It! lets you experiment with the concepts of mean, median, and mode (measures of center). You see the differences among them on a bar graph, as you add or remove blocks to an axis with a given range.
Houghton Mifflin Harcourt
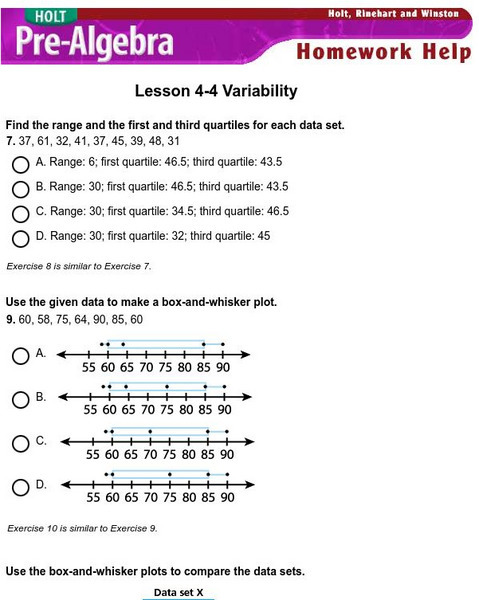
Holt, Rinehart and Winston: Homework Help Independent Practice: Variability
Get independent practice working with variability. Each incorrect response gets a text box explanation and another try. Correct responses are confirmed.
AAA Math
Aaa Math: Central Tendencies Notes
A complete description of mean, median and mode. Interactive games and practice exercises are included.
University of Regina (Canada)
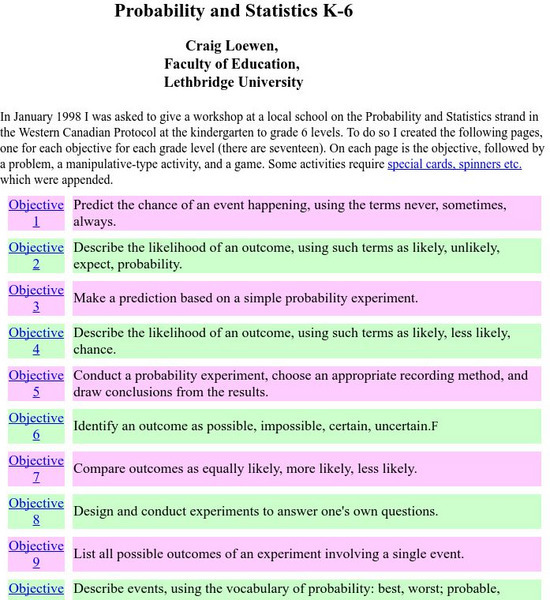
University of Regina: Math Central: Probability and Statistics K 6
A compilation of resources devoted to teaching probability and statistics. The resources are broken into seventeen different objectives that have a problem, activity, and a game.
University of Regina (Canada)
University of Regina: Math Central: Central Tendency Activity
An Internet activity that creates data to be evaluated using statistics skills such as central tendency, data analysis, and graphing. The topic of the exercise is the average height of a student's class.
Wolfram Research
Wolfram Math World: Histogram
This MathWorld site offers a clear definition and examples of a histogram.
Beacon Learning Center
Beacon Learning Center: All That Data 2
Students describe graphs and explore range, measures of central tendency, and distribution in this interactive web lesson.
Math Is Fun
Math Is Fun: Histograms
Explains, with examples, what a histogram is, how it differs from a bar graph, and how to interpret one. Includes a set of practice questions.
Other
Hsor.org: Miguel Chooses a College: Tradeoffs
Use several strategies and criteria to help Miguel determine the college for him.
TOPS Learning Systems
Top Science: Tack Toss [Pdf]
An activity where students toss a set of tacks one hundred times and plot how many land on their sides each time. They then calculate the mode, median, and mean.
McGraw Hill
Glencoe Mathematics: Online Study Tools: Combinations
This site gives a short interactive quiz which allows students to self-assess their understanding of the concept of combinations.
McGraw Hill
Glencoe Mathematics: Online Study Tools: Measures of Central Tendency
This site gives a short interactive quiz which allows students to self-assess their understanding of the concept of measuring central tendency.
McGraw Hill
Glencoe Mathematics: Online Study Tools: Statistics and Probability
The online test demonstrates knowledge of the concepts used in Algebra I. The multiple choice questions assess students on statistics and probability. Topics include biases, samples, and surveys.
Science Education Resource Center at Carleton College
Serc: An in Class Experiment to Estimate Binomial Probabilities
This hands-on activity is appropriate for a lab or discussion section for an introductory statistics class, with 8 to 40 students. Each student performs a binomial experiment and computes a confidence interval for the true binomial...
Science Education Resource Center at Carleton College
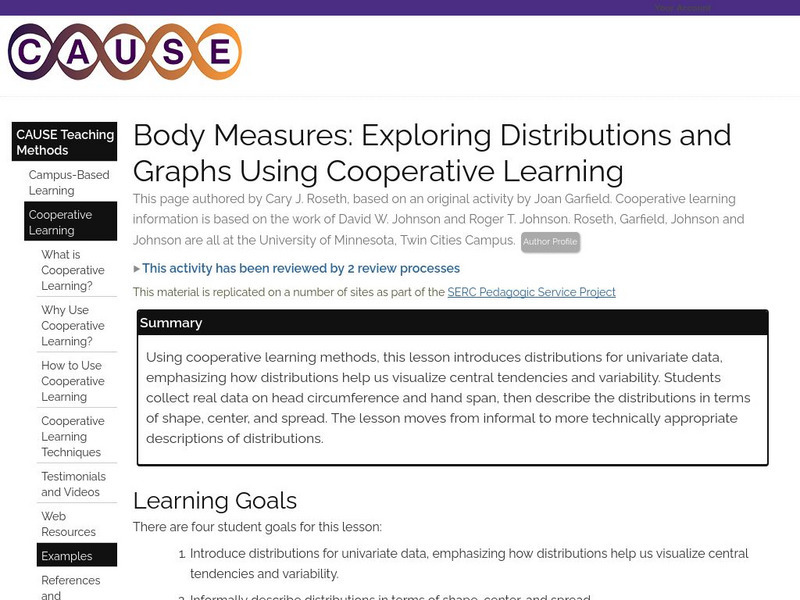
Serc: Exploring Distributions and Graphs Using Cooperative Learning
Using cooperative learning methods, this lesson plan introduces distributions for univariate data, emphasizing how distributions help us visualize central tendencies and variability. Students collect real data on head circumference and...
Mangahigh
Mangahigh: Data: Find the Median From a Table
Students learn about the concept of median by exploring a tutorial. They can then test their knowledge by taking a ten question assessment that increases in difficulty as they correctly answer questions.
Mangahigh
Mangahigh: Data: Find the Mean From a Table
This site provides students practice with the concept of finding the mean. Students can learn about the topic by completing an interactive tutorial. Students can then take a ten question timed test to practice the skill.
Mangahigh
Mangahigh: Data: Find the Range
Students learn about the concept of range by exploring a tutorial. They can then test their knowledge by taking a ten question assessment that increases in difficulty as they correctly answer questions.
Mangahigh
Mangahigh: Data: Trend Graphs
Students explore the concept of frequency trend graphs by working through an online tutorial and then attempting a ten question quiz that increases in difficulty as questions are answered correctly.
Mangahigh
Mangahigh: Data: Understand Discrete and Continuous Data
This site provides students practice with the concept of discrete and continuous data. Students can learn about the topic by completing an interactive tutorial. Students can then take a ten question timed test to practice the skill.
Mangahigh
Mangahigh: Data: Calculate the Median
Students learn about the concept of median by exploring a tutorial. They can then test their knowledge by taking a ten question assessment that increases in difficulty as they correctly answer questions.
Khan Academy
Khan Academy: Comparing Distributions
Practice comparing distributions that are presented in dot plots, histograms, and box plots. Students receive immediate feedback and have the opportunity to try questions repeatedly, watch a video or receive hints.
Soft Schools
Soft Schools: Probability and Statistics Quiz
Students are asked to find the mean, median, mode, and range of a data set. Also, they must be able to interpret graphs and tables, and graphically represent data. The quiz is multiple choice and consists of nine questions, and a summary...
Khan Academy
Khan Academy: Shape of Distributions
Practice determining if the data displayed represents left-tailed, right-tailed, or symmetrical data distribution.




![Top Science: Tack Toss [Pdf] Activity Top Science: Tack Toss [Pdf] Activity](https://d15y2dacu3jp90.cloudfront.net/images/attachment_defaults/resource/large/FPO-knovation.png)


