Khan Academy
Khan Academy: Practice: Calculating the Median
Practice ordering a set of data and then finding the median of the data set.
Math Is Fun
Math Is Fun: Quartiles
Explains what quartiles are and some different contexts in which they are used. Includes ten practice questions.
Varsity Tutors
Varsity Tutors: Hotmath: Practice Problems: Statistics
Fifteen problems presented on the topics: mean, median, mode, outliers and graphing statistics. They are given with each step to the solution cleverly revealed one at a time. You can work each step of the problem then click the "View...
Math Is Fun
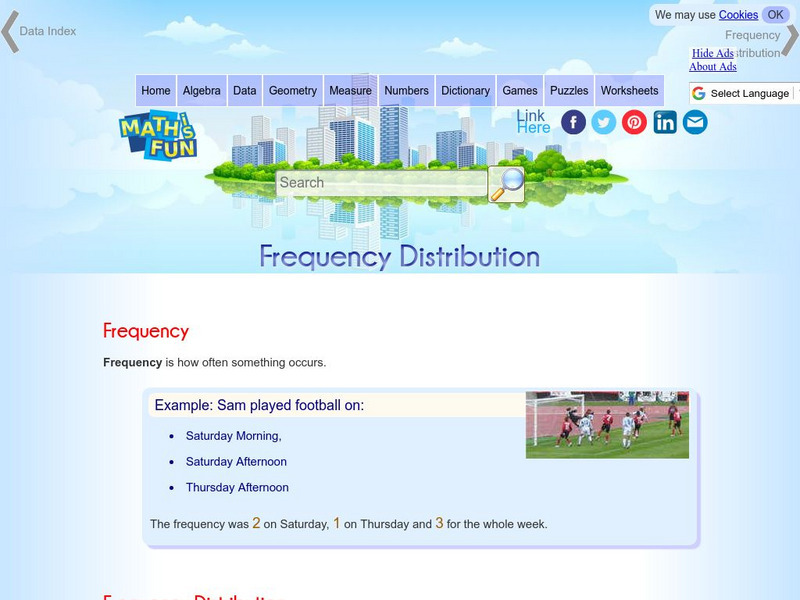
Math Is Fun: Frequency Distribution
Explains, with examples, what a frequency distribution table is. Includes a set of practice questions.
Annenberg Foundation
Annenberg Learner: Analyzing Binomial Probabilities
A tree diagram is a helpful tool for determining theoretical or mathematical probabilities. Toss a coin and watch as branches represent a toss of either head or tails.
Shmoop University
Shmoop: Basic Statistics & Probability: Designing a Study
Presents the steps to follow in designing a study in statistics and explains what makes a good statistical question.
Beacon Learning Center
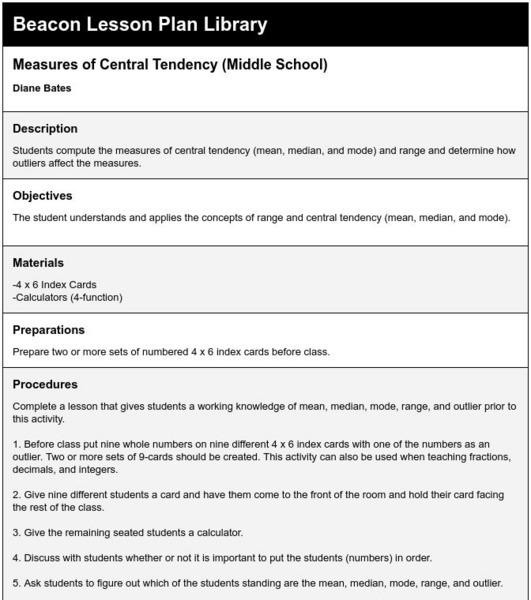
Beacon Learning Center: Measures of Central Tendency (Middle School)
Lesson plan provides practice for calculating measures of center.
Khan Academy
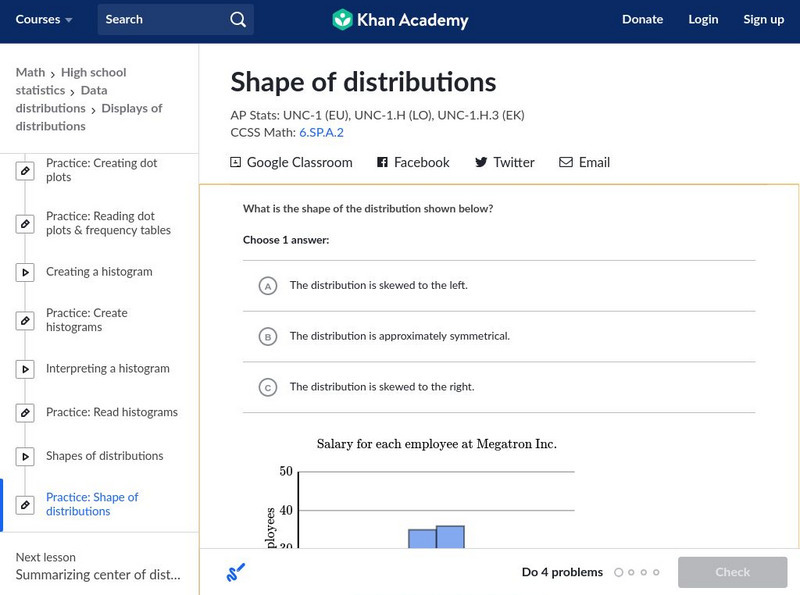
Khan Academy: Shape of Distributions
Practice explaining the shapes of data distributions. Some distributions are symmetrical, perfectly balanced on the left and right. Other distributions are unbalanced. We say they are "askewed" and have "tails." Students receive...
Texas A&M University
Wtamu Virtual Math Lab: Beginning Agebra: Central Tendencies
A tutorial to understand the three central tendencies and how to find them, as well as the standard deviation of values. Offers a discussion and practice problems.
Illustrative Mathematics
Illustrative Mathematics: 6.sp4, 5c Puzzle Times
A performance task asking students to create a graph of provided information and then find the mean and the median of the data.
Palomar Community College District
Palomar College: Mode, Median, Mean Examples
A series of step-by-step worked problems demonstrating how to take a set of data and produce the measures of central tendency. Hints are provided along the way and the final measures are shown for the user to check.
Alabama Learning Exchange
Alex: Statistically Thinking
The object of this project is for students to learn how to find univariate and bivariate statistics for sets of data. Also, the students will be able to determine if two sets of data are linearly correlated and to what degree. The...
Better Lesson
Better Lesson: Analyze This! Mean Median Mode and Range
Finding measures of central tendency will be applied to the different graphs throughout this unit.
National Council of Teachers of Mathematics
Nctm: Illuminations: Mean and Median
This applet allows the user to investigate the mean, median, and box-and-whisker plot for a set of data that they create.
Cuemath
Cuemath: Average
A comprehensive guide for learning all about averages with definitions, uses, how to calculate it, , solved examples, and practice questions.
PBS
Pbs Learning Media: Central Tendency: Targeted Math Instruction
At the end of this lesson, learners will be able to recognize and apply the concepts of mean, median, and mode in real-life problems.
Louisiana Department of Education
Louisiana Doe: Louisiana Believes: Eureka Math Parent Guide: Statistics
A guide to support parents as they work with their students with statistics.
University of California
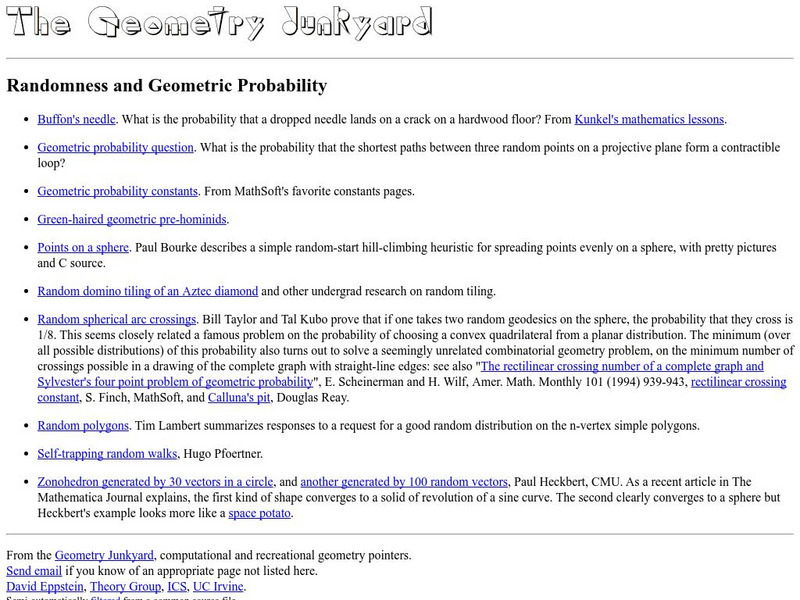
Geometry Junkyard: Randomness and Geometric Probability
This site contains information on the randomness and geometric probability. It includes several links for information, includes real life examples.
National Council of Teachers of Mathematics
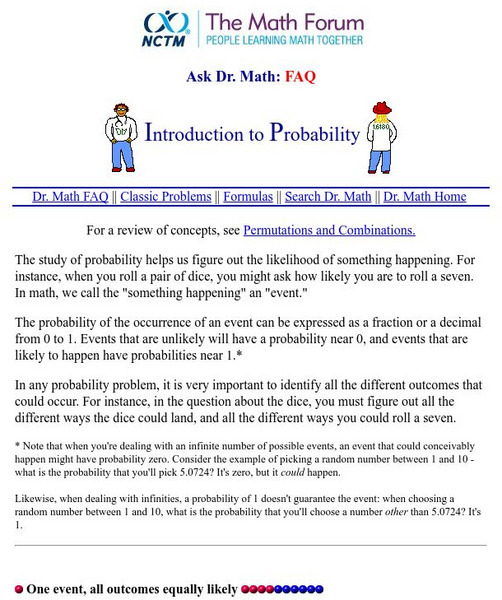
The Math Forum: Ask Dr. Math; Introduction to Probability
A good introduction to concepts in probability, this page also gives a great definition of sample space. Scroll down halfway to find sample space.
Shodor Education Foundation
Shodor Interactivate: Simple Plot
A java applet that helps a student to create a scatter plot using the coordinates and axes and given data.
Shodor Education Foundation
Shodor Interactivate: Stats and Probability Concepts
Many topics on Statistics and Probability are defined and linked here. Click on any of them to move to a more detailed discussion of the term.
Rice University
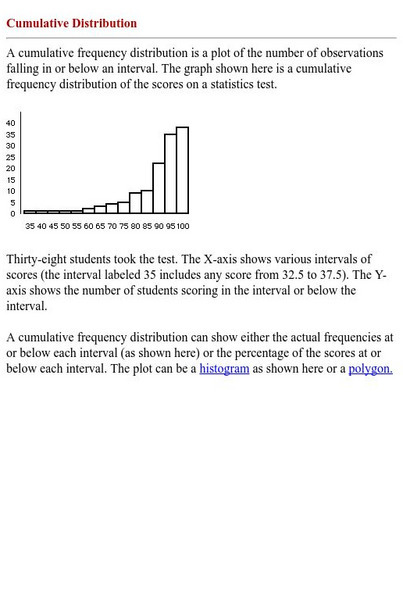
Hyper Stat Online Statistics Textbook: Cumulative Distribution
This resoruce explains how to read a cumulative frequency distribution graph.
Other
Northern Michigan University: Line Plots
The author utilizes a line plot to demonstrate what an "outlier" is, what "clusters" are, and what "gaps" are.
McGraw Hill
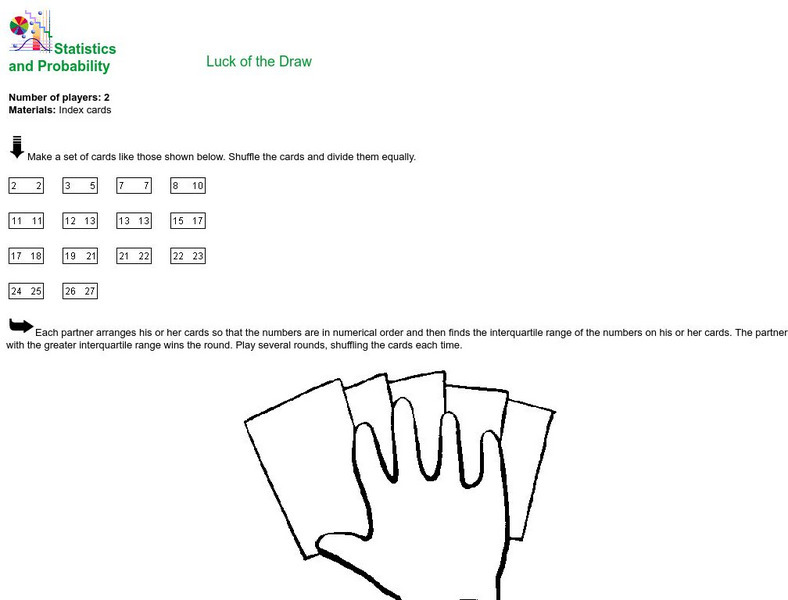
Mc Graw Hill Education: Glencoe: Statistics and Probability: Luck of the Draw
Instructions for creating and playing a simple card game through which students can practice calculating the interquartile range from a set of numbers.


