Curated OER
Super Ticket Sales
Use this graphing data using box and whisker plots lesson to have learners make box and whisker plots about ticket sales of popular movies. They find the mean, median, and mode of the data. Pupils compare ticket sales of the opening...
Teach Engineering
Breathing Cells
Pairs work together to determine whether unknown solutions are either acids or bases by using a red cabbage indicator solution. After determining the general pH of the unknown solution, classmates blow into the same indicator after...
National Research Center for Career and Technical Education
Health Science: Back to Basics
This lesson focuses on unit conversion, proportions, ratios, exponents, and the metric system. Discuss measurement with your math class and demonstrate how to solve several health-science word problems. Give learners a chance to visit an...
Curated OER
Rational Numbers
Young scholars investigate rational numbers in this algebra lesson plan. They graph systems of equations and use technology to find the point of intersection. They need a TI for this assignment.
Curated OER
To the Moon
Pupils explore circumference manipulating Moon Pie wrapper. In this geometry lesson, they manipulate snack wrappers to find circumference, diameter, radius and distance.
Alabama Learning Exchange
The Mean, Median, and Mode Chain Gang
Students analyze a set of data. They work in cooperative groups and use chain links to identify the mean, median, and mode of the chain.
Curated OER
Fit With Fiber
Sixth graders investigate the nutritional value of different types of cereal. They take a survey of students that ate breakfast and create a circle graph with the results. Students examine the nutritional information on the sides of the...
Curated OER
Circles in the Landscape: Irrigating Oklahoma Crops
How do you grow crops in a area with insufficient rainfall? Why you irrigate, of course. Class members investigate irrigation systems by designing a system of their own. After examining irrigation related concepts, vocabulary terms, and...
Curated OER
Managing Nutrients in Livestock Manure
Livestock managers reinforce math and science skills while learning about the nutrients found in manure. They predict which animal produces the largest amount and which animal's manure contains the most nitrogen. Finally, they compare...
Shodor Education Foundation
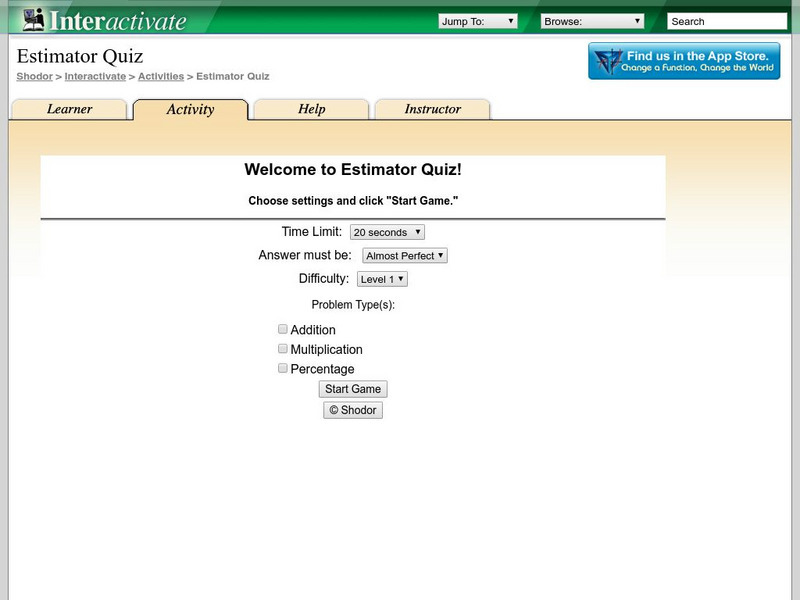
Shodor Interactivate: Estimator Quiz
This activity allows the student to practice estimating the results of addition multiplication and percentage problems. The activity has 3 levels of challenge.
Google
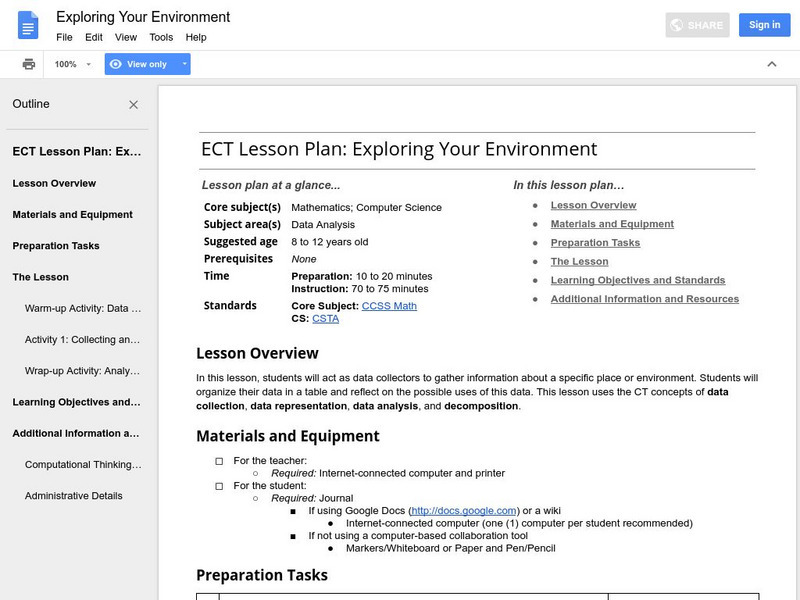
Google for Education: Exploring Your Environment
Students act as data collectors who gather different types of information about various things in the environment. Students then organize the data in a table and reflect on the possible uses of this data.
Google
Google for Education: What Is Data
The purpose of this lesson is to show students what data is and how prevalent it is in their lives They also learn how to use data to make informed decisions. These activities are an excellent way to introduce the year as students are...
BBC
Bbc: Ks2 Bitesize: Maths: Handling Data
This site provides games, quizes, and information about handling data, including mode, median, and mean.
Annenberg Foundation
Annenberg Learner: Learning Math: Min, Max and the Five Number Summary
Explore how to interpret a large set of data by dividing it up into smaller portions in order to answer statistical questions.
Other
A River Runs Through It Learning Project
In this year long learning project integrating mathematics and science, students solve environmental problems using data collection and problem solving concepts. Designed for upper elementary gifted students. Interactive components and...
Education Development Center
Math Partners: Statistics and Probability [Pdf]
Comprehensive unit that consists of lessons and activities designed to help students learn statistics and probability concepts.
Center for Innovation in Engineering and Science Education, Stevens Institute of Technology
Ciese Collaborative Projects: Down the Drain: How Much Water Do You Use?
How much water do you use everyday? Find out in this engaging investigation, where you compare your water usage with your classmates and other people around the world. An exploration filled with lots of math and science that students are...
University of Texas
Inside Mathematics: Baseball Players [Pdf]
This task challenges students to demonstrate understanding of the concept of measure of center.
Math Drills
Math Drills: Statistics and Probability Worksheets
Download these free worksheets to sharpen your skills with statistics and probability. Sheets focus on collecting and organizing data, measures of central tendency (mean, median, mode, and range), and probability.
Houghton Mifflin Harcourt
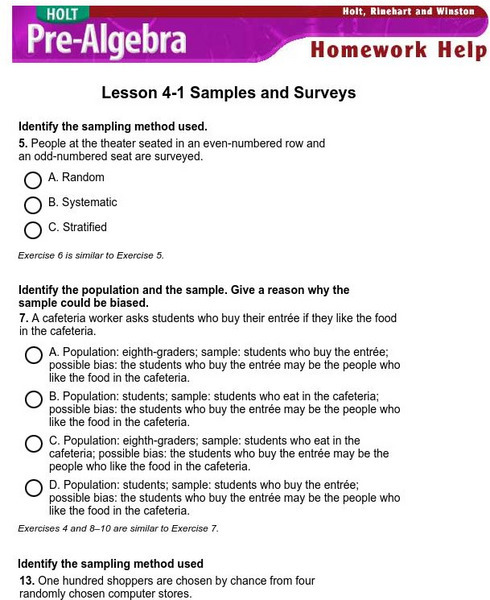
Holt, Rinehart and Winston: Homework Help Independent Practice: Samples and Surveys
Get independent practice working with samples and surveys. Each incorrect response gets a text box explanation and another try. Correct responses are confirmed.
Houghton Mifflin Harcourt
Holt, Rinehart and Winston: Homework Help Independent Practice: Misleading Graphs and Statistics
Get independent practice working with misleading graphs and statistics. Each incorrect response gets a text box explanation and another try. Correct responses are confirmed.
AAA Math
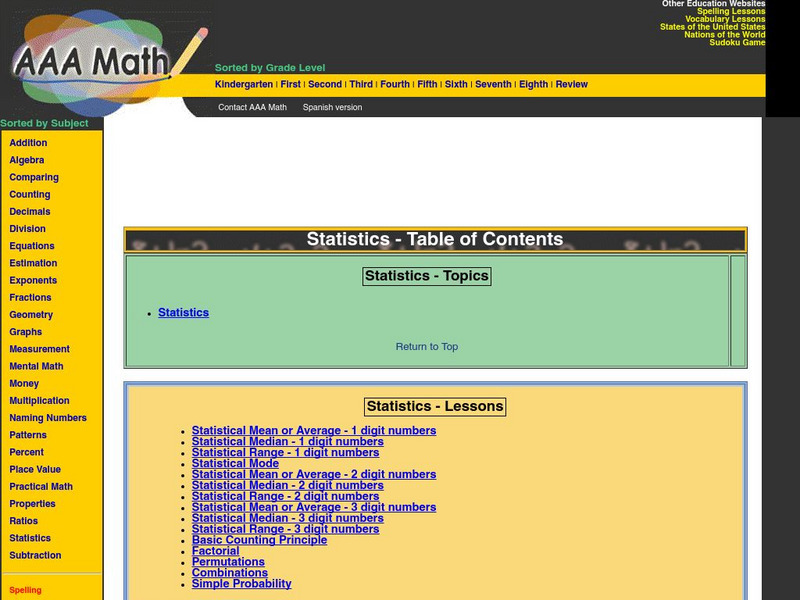
Aaa Math: Central Tendencies Notes
A complete description of mean, median and mode. Interactive games and practice exercises are included.
University of Regina (Canada)
University of Regina: Math Central: Problem Solving Techniques
Different approaches to incorporate problem-solving skills into the elementary mathematics classroom.
University of Regina (Canada)
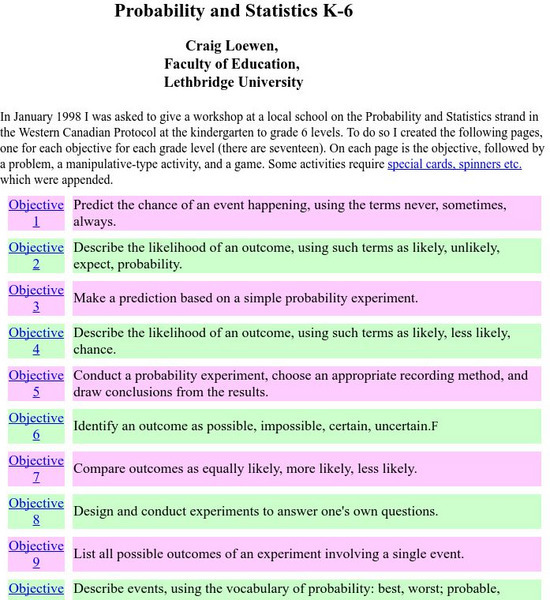
University of Regina: Math Central: Probability and Statistics K 6
A compilation of resources devoted to teaching probability and statistics. The resources are broken into seventeen different objectives that have a problem, activity, and a game.


