Sophia Learning
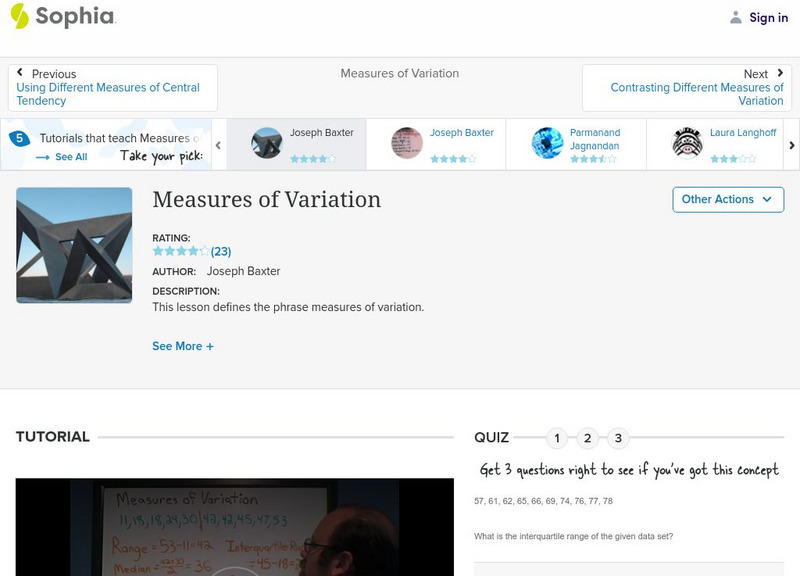
Sophia: Measure of Variation
Explore the measures of variation and check understanding with an assessment.
Shmoop University
Shmoop: Basic Statistics & Probability: Designing a Study
Presents the steps to follow in designing a study in statistics and explains what makes a good statistical question.
Khan Academy
Khan Academy: Reading Dot Plots & Frequency Tables
Practice reading basic dot plots and frequency tables. Students receive immediate feedback and have the opportunity to try questions repeatedly, watch a video or receive hints.
National Council of Teachers of Mathematics
The Math Forum: Drexel Math Forum: Adventures in Statistics
This lesson incorporates problem-solving and data collection to satisfy a fifth grade class's curiosity about the size of their classroom with respect to a sixth grade classroom.
National Council of Teachers of Mathematics
The Math Forum: Growth Creature Lab Data Collecting
Lesson plan completely explains how students will collect data on the growth of an "alligator" and determine the relationship of the growth data to the Fundamental Theorem of Similarity and to topics in geometry in general. All of the...
University of Georgia
University of Georgia: Inter Math: Types of Data
This site has a concise definition of "Data," plus examples of data types and collection methods.
Beacon Learning Center
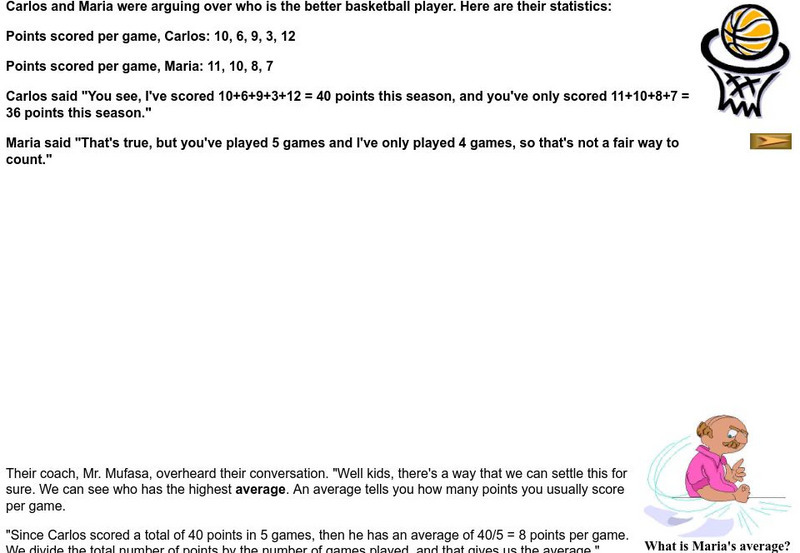
Beacon Learning Center: Basketball Means
Students explore and practice calculating averages in this interactive web lesson.
Alabama Learning Exchange
Alex: M&m's and Blogs: Interpreting Data!
In this hands-on, technology-rich lesson, students will interpret data. The students will define words involving graphs, create a bar graph using M&M's, and post information from their findings on the internet. The students will also...
Better Lesson
Better Lesson: Describing Data Activity
This is a hands on activity to get the students thinking about how to describe data sets.
Better Lesson
Better Lesson: Say It With Stats! Review
The students will be working in centers to review for their test. The centers will consist of a computer rotation, versa-tiles, and a teacher center. All centers will reinforce concepts learned throughout this unit to prepare them for...
Better Lesson
Better Lesson: Misleading Leading Graphs
Through the use of real life data, the students will be looking at a variety of graphs to decide if they are displaying misguided information.
Better Lesson
Better Lesson: Histogram Activity
Sixth graders will see how an actuary uses histograms to analyze the frequency of events to determine risk.
Better Lesson
Better Lesson: Analyze This! Mean Median Mode and Range
Finding measures of central tendency will be applied to the different graphs throughout this unit.
Better Lesson
Better Lesson: Statistically Speaking....
Determining a good statistical question is the foundation of statistics.
Better Lesson
Better Lesson: 100 Students Project: Project Reflection
Sixth graders watch their 100 Students video and reflect on their learning during the project.
Better Lesson
Better Lesson: 100 Students Project: Analyzing Survey Results
Sixth graders work in groups to analyze the survey data and plan their presentations for the 100 Students Project.
Cuemath
Cuemath: Average
A comprehensive guide for learning all about averages with definitions, uses, how to calculate it, , solved examples, and practice questions.
Cuemath
Cuemath: Median
A comprehensive guide for learning all about the median with definitions, how to find it, solved examples, and practice questions.
Quia
Ixl Learning: Histograms
Brush up on your math skills relating to histograms then try some practice problems to test your understanding.
PBS
Pbs Learning Media: Central Tendency: Targeted Math Instruction
At the end of this lesson, students will be able to recognize and apply the concepts of mean, median, and mode in real-life problems.
National Council of Teachers of Mathematics
Nctm: Comparing Properties of the Mean and Median
Through the use of technology, students can investigate how the mean and median of a set of date compares when values the data changes.
Other
Algebra and Data Analysis Review
The resource measures students knowledge of skills, processes, and concepts needed in Algebra I and Data Analysis courses. Assessments, mini-assessments, answer keys, expectations, and indicators are included.
PBS
Pbs Teachers: Sports and Math: Batting Averages and More
Set up a spreadsheet using a computer or graphing calculator, and perform calculations using columns. Calculate percentages and solve a system of equations regarding baseball statistics.
US Department of Education
National Center for Education Statistics: Nces Classroom
Just what is the NCES Students' Classroom? In addition to many useful features, this site provides math and statistical activities tailored to a middle and elementary school students.


