Curated OER
“I Can” Common Core! 6th Grade Math
Help your sixth graders reach their Common Core math standards by providing them with a checklist of "I can" statements for each standard. As each concept is covered, kids can check it off, as long as they can do what it states.
American Statistical Association
The Gumball Machine
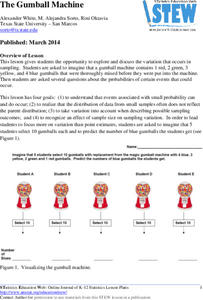
Chew on an activity for probability. Given information on the number of gumballs in a gumball machine, scholars consider how likely it is to randomly draw a blue gumball and how many of each color they would draw in 10 trials if the...
Workforce Solutions
Miniature Gulf Coast Project
Scholars show what they know about data collection and analysis with an activity that examines a smaller population of Houghton, Texas. Independently or in pairs, learners identify their research question, gather, graph, and analyze...
Utah Education Network (UEN)
Statistics
Find the value in analyzing data values. Statistics is the focus in the fifth of seven installments of the 6th Grade Math series. Individuals learn to examine dot plots, histograms, and box plots by considering the shape, mean, median,...
Teach Engineering
Exploring Variables While Testing and Improving Mint-Mobiles (for Middle School)
There are more ways to use mint candies than to just eat them. In groups, learners design and build race cars using mint candies, drinking straws, Popsicle sticks, index cards, and other materials. They decide on an independent variable...
US Department of Commerce
Exploring Sampling Variability - Higher Education Attainment Across The United States
More education in statistics is always beneficial. Given cards that provide the proportion of adults with bachelor's degrees in 10 random US states, scholars individually determine the sample percentage of states in which more than 30...
National Museum of Mathematics
Hands-On Data Analysis
Jump at the chance to use this resource. A kinesthetic activity has classmates jumping in several different ways (standing, single-step, and multiple-step jumps) to create handprints on poster paper taped to the wall. They measure the...
Mathed Up!
Frequency Tables
The section of a larger General Certificate of Secondary Education math review requires pupils to summarize numerical data presented in a frequency table. Scholars determine the number of data points, the range, the mean, and the...
NOAA
Investigating Sea Level Using Real Data
The news reports on rising sea level, but how do scientists measure this rise? Scholars use NOAA data including maps, apps, and images to work through five levels of activities related to sea level. Each level in the series adds a new...
PBS
The Lowdown — Examining California's Prison System: Real-World Ratio
Free yourself from the shackles of traditional math lessons. Young mathematicians investigate race, gender, and age differences in California's prison system. They use provided graphics to compare the prison population with the state's...
American Statistical Association
Tell it Like it is!
Scholars apply prior knowledge of statistics to write a conclusion. They summarize using correct academic language and tell the story of the data.
American Statistical Association
Happy Birthday to . . . Two?
How many people do you need in a room before two likely share the same birthday? Scholars consider this puzzle by analyzing a set of data. They ponder how to divide the data and determine the proper size of a group for this event to...
Teach Engineering
Sudsy Cells
Let's hope that your soap is doing what it's supposed to! The second of six installments in the Cells unit has scholars perform an experiment cultivating bacteria in Petri dishes. They test soaps and detergents to see which is most...
Teach Engineering
Physics Tug of War
Slide books with a little assistance from Newton. Using books, groups create a demonstration of Newton's Second Law of motion. Pupils compare the distance traveled by one and two books when they apply a force to them.
Teach Engineering
Balsa Glider Competition
Change one variable and try again. Teams build basic balsa gliders and collect data on their flight distances and times. Through collaboration, the team decides on two modifications to make to the basic design and collect data for the...
Teach Engineering
What a Drag!
Stop and drop what is in your hand! Pupils investigate how form effects drag in the 12th part of a 22-part unit on aviation. Groups create equally weighted objects and determine which one falls the fastest by collecting data.
Indiana Department of Education
The Represented World: Communication—Packaging
Challenge your classes to design and market a new product. Collaborative groups use geometry skills to create packaging for their products. Finally, they plan a marketing strategy to present to a marketing specialist.
Indiana Department of Education
Amusement of the Future
Take your class on the ride of their lives! Physical science scholars get an in-depth look at potential and kinetic energies in an amusement park-themed unit. Students research, design, and promote their own amusement parks,...
EngageNY
Describing the Center of a Distribution Using the Median
Find the point that splits the data. The lesson presents to scholars the definition of the median through a teacher-led discussion. The pupils use data lists and dot plots to determine the median in sets with even and odd number of data...
EngageNY
Presenting a Summary of a Statistical Project
Based upon the statistics, this is what it means. The last instructional activity in a series of 22 has pupils present the findings from their statistical projects. The scholars discuss the four-step process used to complete the project...
EngageNY
Summarizing a Data Distribution by Describing Center, Variability, and Shape
Put those numbers to work by completing a statistical study! Pupils finish the last two steps in a statistical study by summarizing data with displays and numerical summaries. Individuals use the summaries to answer the statistical...
EngageNY
Describing Center, Variability, and Shape of a Data Distribution from a Graphical Representation
What is the typical length of a yellow perch? Pupils analyze a histogram of lengths for a sample of yellow perch from the Great Lakes. They determine which measures of center and variability are best to use based upon the shape of the...
EngageNY
Comparing Data Distributions
Box in the similarities and differences. The 19th activity in a unit of 22 presents class members with multiple box plots to compare. Learners use their understanding of five-number summaries and box plots to find similarities and...
EngageNY
Connecting Graphical Representations and Numerical Summaries
Which graph belongs to which summary statistics? Class members build upon their knowledge of data displays and numerical summaries to connect the two. Pupils make connections between different graphical displays of the same data in...


