Beacon Learning Center
Beacon Learning Center: Basketball Means
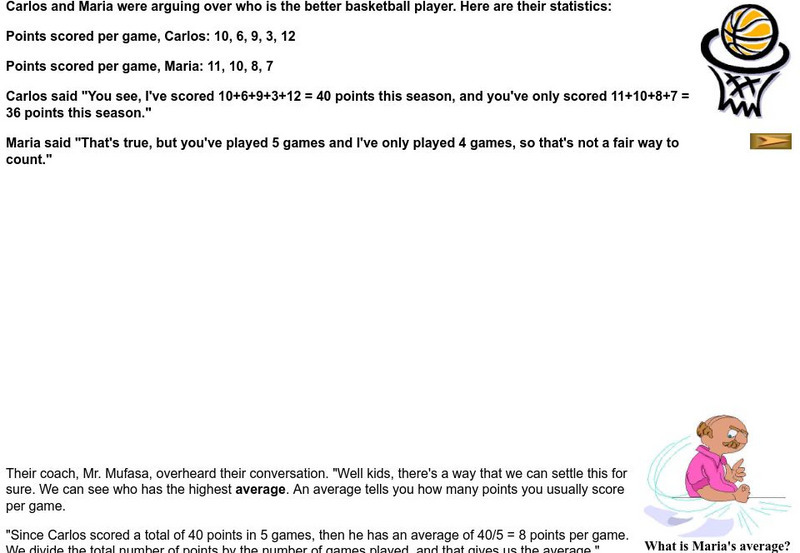
Students explore and practice calculating averages in this interactive web lesson.
Better Lesson
Better Lesson: Describing Data Activity
This is a hands on activity to get the students thinking about how to describe data sets.
Better Lesson
Better Lesson: Say It With Stats! Review
The students will be working in centers to review for their test. The centers will consist of a computer rotation, versa-tiles, and a teacher center. All centers will reinforce concepts learned throughout this unit to prepare them for...
Better Lesson
Better Lesson: Analyze This! Mean Median Mode and Range
Finding measures of central tendency will be applied to the different graphs throughout this unit.
Better Lesson
Better Lesson: Statistically Speaking....
Determining a good statistical question is the foundation of statistics.
National Council of Teachers of Mathematics
Nctm: Illuminations: Mean and Median
This applet allows the user to investigate the mean, median, and box-and-whisker plot for a set of data that they create.
Shodor Education Foundation
Shodor Interactivate: Measures
Enter data and view the mean, median, variance, and standard deviation of the data set.
Cuemath
Cuemath: Average
A comprehensive guide for learning all about averages with definitions, uses, how to calculate it, , solved examples, and practice questions.
Cuemath
Cuemath: Median
A comprehensive guide for learning all about the median with definitions, how to find it, solved examples, and practice questions.
Quia
Ixl Learning: Mean, Median, Mode, and Range
Brush up on your math skills relating to mean, median, mode, and range then try some practice problems to test your understanding.
PBS
Pbs Learning Media: Central Tendency: Targeted Math Instruction
At the end of this lesson, learners will be able to recognize and apply the concepts of mean, median, and mode in real-life problems.
Better Lesson
Better Lesson: Going to College
Sixth graders start to familiarize themselves with applying and attending college. This will serve as a frame for the work they will do throughout the unit.
National Council of Teachers of Mathematics
Nctm: Comparing Properties of the Mean and Median
Through the use of technology, students can investigate how the mean and median of a set of date compares when values the data changes.
National Council of Teachers of Mathematics
Nctm: Figure This: The Race [Pdf]
A challenge that combines skills in problem solving and logical reasoning. See if you can figure out who will win the race by determining the rate of speed of each runner. A one page activity from NCTM Math Challenges for Families...
Other
Algebra and Data Analysis Review
The resource measures students knowledge of skills, processes, and concepts needed in Algebra I and Data Analysis courses. Assessments, mini-assessments, answer keys, expectations, and indicators are included.
McGraw Hill
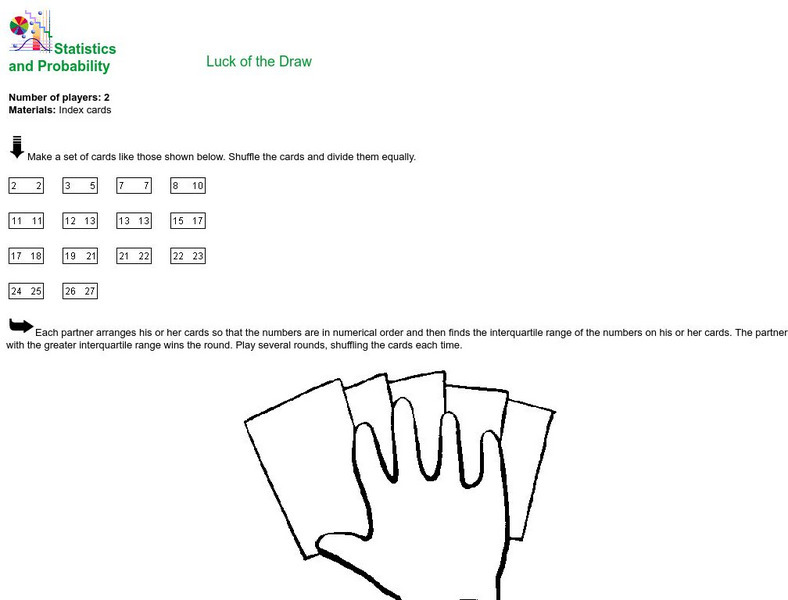
Mc Graw Hill Education: Glencoe: Statistics and Probability: Luck of the Draw
Instructions for creating and playing a simple card game through which students can practice calculating the interquartile range from a set of numbers.
Soft Schools
Soft Schools: Outliers
On this websites students explore the concept of outliers. Students are given several data sets and investigate how outliers can effect the mean and median of a data set.
National Council of Teachers of Mathematics
Nctm: Figure This: Who's on First Today?
Batter up! Who has the higher batting average, Joe McEwing or Mike Lieberthal? Try your computation and averaging skills in this real-world math challenge. Learn how sharpening your averaging skills can be valuable in real life...
ClassFlow
Class Flow: Statistics Landmarks Vote
[Free Registration/Login Required] This lesson uses clustering to explore the concept of mean, median, and mode of a set of data and calculates the arithmetic mean.
Free Math Help
Free Math Help: Arithmetic Mean
Students learn how to find the arithmetic mean of data. The tutorial consists of a definition and examples with detailed solutions.
ClassFlow
Class Flow: Averages Handling Data
[Free Registration/Login Required] This is a dynamic flipchart displaying and using measures of central tendency- mean, medium, mode, and average. Pictures capture the eye, for sure.
ClassFlow
Class Flow: Mean, Median, and Mode
[Free Registration/Login Required] This flipchart contains a video, notes, and rolling dice activity on mean, median and mode.
Math Is Fun
Math Is Fun: How to Find the Mean
This math tutorial illustrates the mean of a set of data.
Math Slice
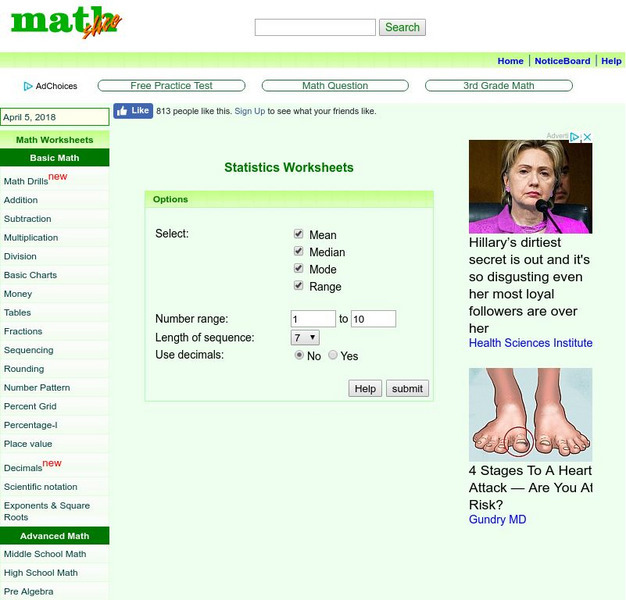
Math Slice: Statistics: Math Worksheets
This tool allows you to create worksheets where students calculate the mean, median, mode or range of a set of numbers.



![Nctm: Figure This: The Race [Pdf] Activity Nctm: Figure This: The Race [Pdf] Activity](https://content.lessonplanet.com/knovation/original/21689-eb1624724f217ea0d5cca6ea1c84adce.jpg?1661255331)

