Cuemath
Cuemath: Measures of Central Tendency
A comprehensive guide for learning all about measures of central tendency with definitions of mean, median, and mode, solved examples, and practice questions.
E-learning for Kids
E Learning for Kids: Math: Music Center: Mixed Problem Solving
Help Dracco the drummer with solving different fun math problems.
Concord Consortium
Seeing Math: Plop It
Plop It! lets you experiment with the concepts of mean, median, and mode (measures of center). You see the differences among them on a bar graph, as you add or remove blocks to an axis with a given range.
Houghton Mifflin Harcourt
Holt, Rinehart and Winston: Homework Help Independent Practice: Measures of Central Tendency
Get independent practice working with the mean, median and mode. Each incorrect response gets a text box explanation and another try. Correct responses are confirmed.
Houghton Mifflin Harcourt
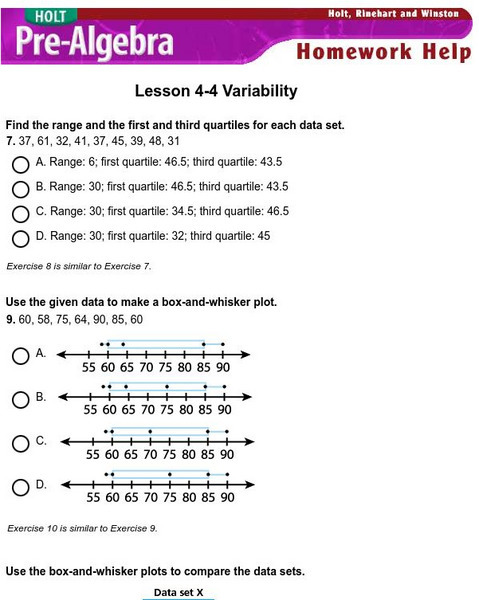
Holt, Rinehart and Winston: Homework Help Independent Practice: Variability
Get independent practice working with variability. Each incorrect response gets a text box explanation and another try. Correct responses are confirmed.
AAA Math
Aaa Math: Central Tendencies Notes
A complete description of mean, median and mode. Interactive games and practice exercises are included.
University of Regina (Canada)
University of Regina: Math Central: Central Tendency Activity
An Internet activity that creates data to be evaluated using statistics skills such as central tendency, data analysis, and graphing. The topic of the exercise is the average height of a student's class.
University of Georgia
University of Georgia: Measures of Variation
Lesson plan introduces and explains how to calculate measures of variation concepts such as range and quartile.
Beacon Learning Center
Beacon Learning Center: All That Data 2
Students describe graphs and explore range, measures of central tendency, and distribution in this interactive web lesson.
Beacon Learning Center
Beacon Learning Center: All That Data
Students analyze data by finding the mean, median, mode, and range of a set of numbers. Line plots, bar graphs, and circle graphs are also included in this lesson.
Other
Online Statistics Education: Measures of Variability
Learning Objectives cover the areas of the Measures of Variability. Explanations are given for: variability, range, interquartile range, variance, and standard deviation. Examples and quizzes are also provided.
Other
Csulb: Stem: How Much Water Fits on a Penny? [Pdf]
Students explore mean, median, mode, and range with this hands on activity.
Scholastic
Scholastic: Study Jams! Math: Data Analysis: Mean Average
Students can watch a step by step lesson showing how to determine the mean. Then sing along with a song and test your knowledge of understanding when you have completed the activities.
McGraw Hill
Mc Graw Hill Education: Glencoe: Measures of Variation
Lesson examples that review how to calculate measures of variation such as range and outliers.
Ministry of Education, Sports & Culture (Samoa) Government
Mesc: Samoa School Net: Mean, Median, Mode
A 2-part learning module on mean, median, and mode. Explains their definitions and discusses how to choose which term to best describe your data. Includes many well-illustrated examples. (There are a few typos, and money amounts are in...
Mangahigh
Mangahigh: Data: Find the Median
Students learn about the concept of median by exploring a tutorial. They can then test their knowledge by taking a ten question assessment that increases in difficulty as they correctly answer questions.
Mangahigh
Mangahigh: Data: Find the Median From a Table
Students learn about the concept of median by exploring a tutorial. They can then test their knowledge by taking a ten question assessment that increases in difficulty as they correctly answer questions.
Mangahigh
Mangahigh: Data: Calculate the Median
Students learn about the concept of median by exploring a tutorial. They can then test their knowledge by taking a ten question assessment that increases in difficulty as they correctly answer questions.
Other
Raymond Geddes and Company, Inc.: Analyzing Product Price and Sales Data
Lesson plan provides a real-world application of mean, median, mode, and range.
Khan Academy
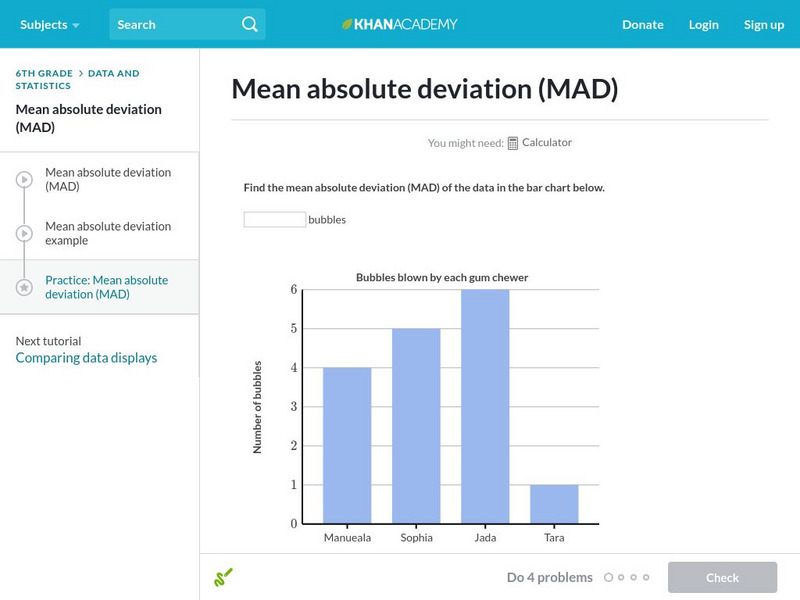
Khan Academy: Mean Absolute Deviation (Mad)
Practice calculating the mean absolute deviation.
Khan Academy
Khan Academy: Shape of Distributions
Practice determining if the data displayed represents left-tailed, right-tailed, or symmetrical data distribution.
Khan Academy
Khan Academy: Calculating the Mean
Practice calculating the mean of a data set. Data is displayed in different forms of graphical representation.
Khan Academy
Khan Academy: Practice: Calculating the Median
Practice ordering a set of data and then finding the median of the data set.
Khan Academy
Khan Academy: Calculating the Median
Practice finding the median of a data set. Students are able to check their answers, view a solution, and watch a video or use a hint.


