Texas Instruments
Texas Instruments: Getting Started With Probability Simulations App
Explore probability theory with interactive animation that simulates the rolling of dice, tossing of coins and generating random numbers. Evaluation options include bar graphs, table of trials data, settings for specifying the number of...
Texas Instruments
Texas Instruments: Logic of Significance/hypothesis Testing
This set covers the logic of significance/hypothesis tests. Students decide whether a one- or two-tailed test is appropriate. They also decide, by comparing the p-value to the alpha level, whether statistically significant evidence exists.
Texas Instruments
Texas Instruments: Taste Test
Students collect sample data and use the calculator to create pictographs, bar graphs, and pie graphs to demonstrate the favorite brand in the sample data.
Texas Instruments
Texas Instruments: Hat Trick
In this activity, students learn to solve a real-world problem in economics. Students get to understand how surveys often use a sample of people rather than all of the people involved. They also learn how to make decisions based on the...
Texas Instruments
Texas Instruments: Do You Have a Temperature?
In this activity, students represent and analyze climate data. They use linear regressions to understand the relationship between temperatures measured in the Fahrenheit and Celsius scales and examine conversion factors.
Texas Instruments
Texas Instruments: Keeping Up With the Joneses
This activity explores what happens to measures of center and spread when outliers are introduced and when sample size varies.
Texas Instruments
Texas Instruments: The Ordinary Man
In this activity, students estimate the heights of people and compare the estimates to the actual heights in a scatter plot.
Texas Instruments
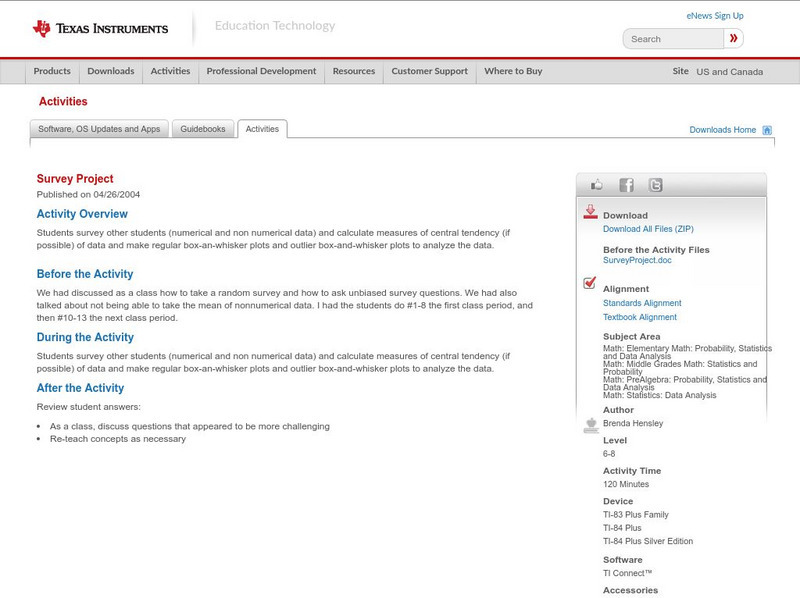
Texas Instruments: Survey Project
Students survey other students (numerical and non numerical data) and calculate measures of central tendency (if possible) of data and make regular box-an-whisker plots and outlier box-and-whisker plots to analyze the data.
Math Is Fun
Math Is Fun: Mathopolis: Quartiles Practice
Multiple-choice practice problems that review quartiles. Incorrect answers are corrected with short tutorials.
PBS
Pbs Teachers: Scientific American: Deep Crisis: Salmon Counting
In this lesson, students can explore the techniques of census and population counting by inferring numbers of a virtual population illustrated within a rectangular sampling grid, and observing the accuracy of the technique in relation to...
McGraw Hill
Mc Graw Hill Education: Glencoe: Measures of Variation
Lesson examples that review how to calculate measures of variation such as range and outliers.
Mangahigh
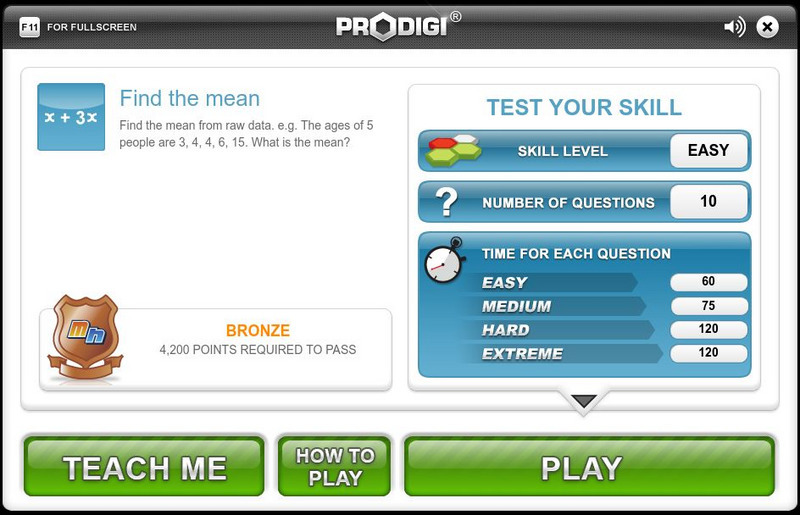
Mangahigh: Data: Find the Mean
Students learn about the concept of mean by exploring a tutorial. They can then test their knowledge by taking a ten question assessment that increases in difficulty as they correctly answer questions.
Mangahigh
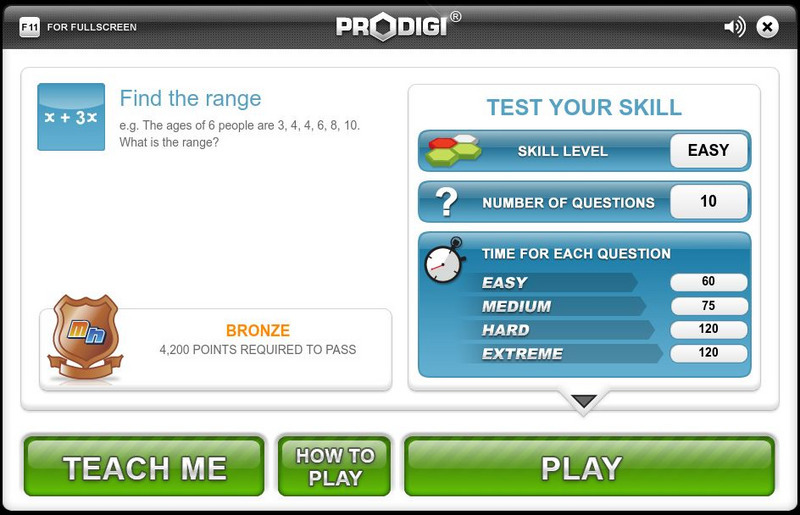
Mangahigh: Data: Find the Range
Students learn about the concept of range by exploring a tutorial. They can then test their knowledge by taking a ten question assessment that increases in difficulty as they correctly answer questions.
Mangahigh
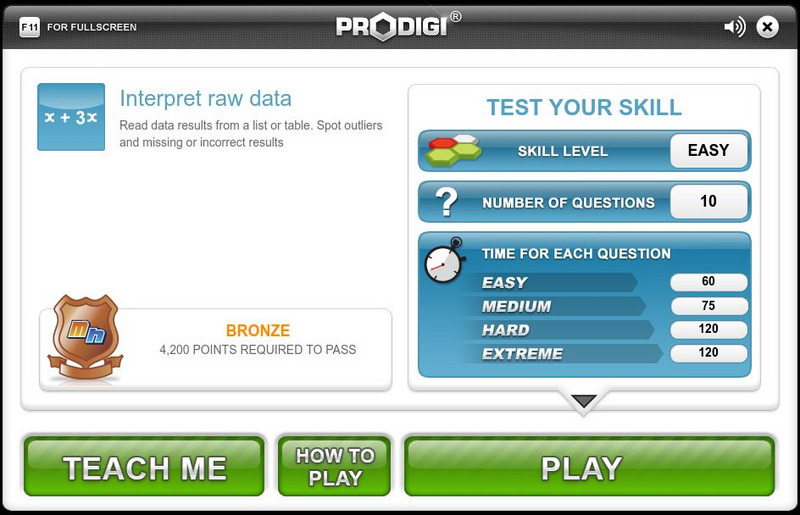
Mangahigh: Data: Interpret Raw Data
Students learn about the concept of interpreting raw data and finding outliers by exploring a tutorial. They can then test their knowledge by taking a ten question assessment that increases in difficulty as they correctly answer questions.
Mangahigh
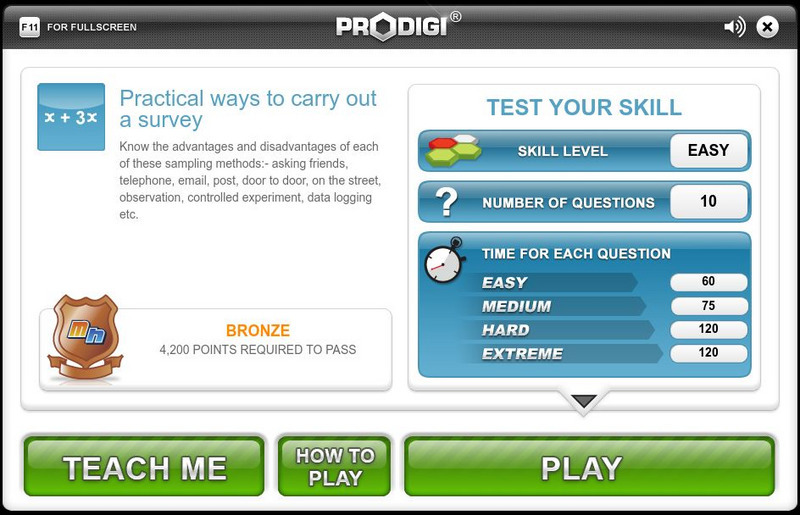
Mangahigh: Data: Practical Ways to Carry Out a Survey
Students learn about the concept of taking a survey by exploring a tutorial. They can then test their knowledge by taking a ten question assessment that increases in difficulty as they correctly answer questions.
Mangahigh
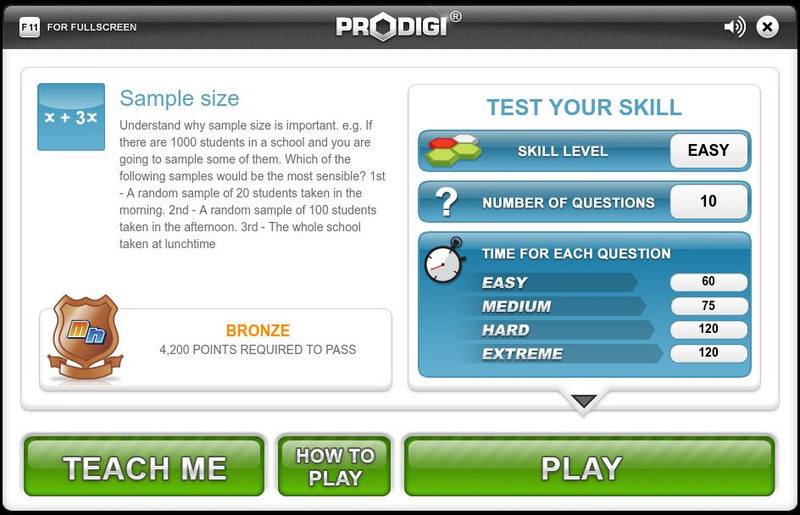
Mangahigh: Data: Sample Size
This site provides students practice with the concept of sample size. Students can learn about the topic by completing an interactive tutorial. Students can then take a ten question timed test to practice the skill.
Mangahigh
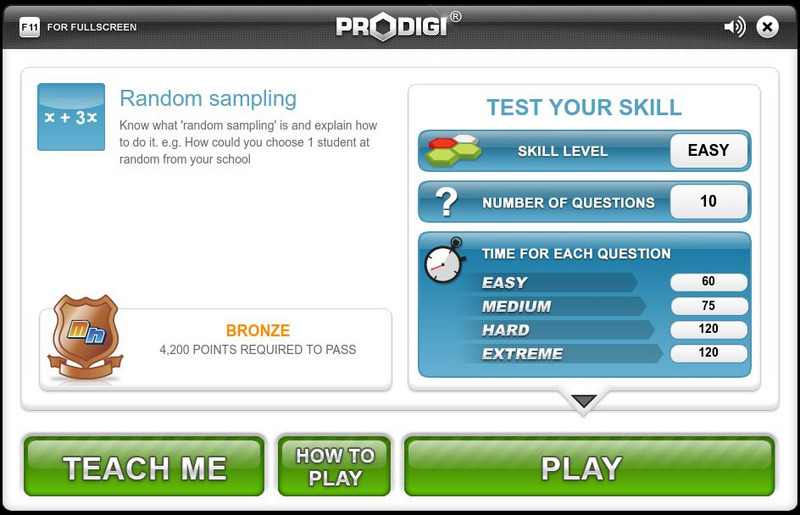
Mangahigh: Data: Random Sampling
This site provides students practice with the concept of random sampling. Students can learn about the topic by completing an interactive tutorial. Students can then take a ten question timed test to practice the skill.
Mangahigh
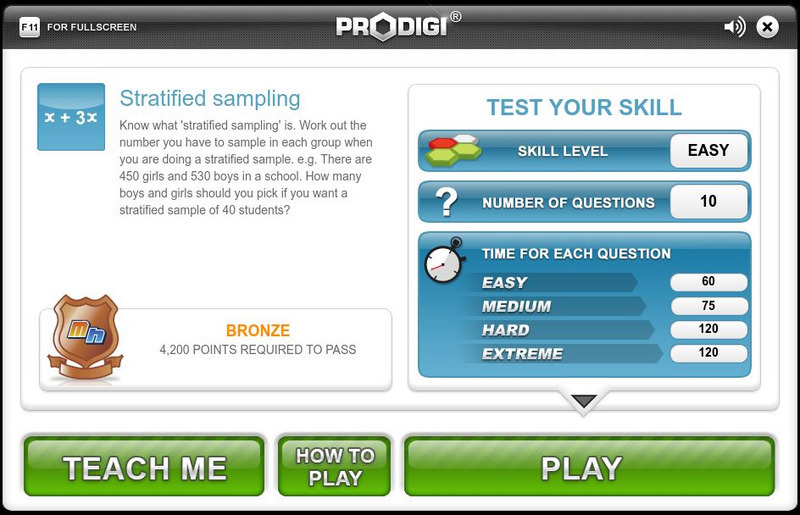
Mangahigh: Data: Stratified Sampling
This site provides students practice with the concept of stratified sampling. Students can learn about the topic by completing an interactive tutorial. Students can then take a ten question timed test to practice the skill.
Khan Academy
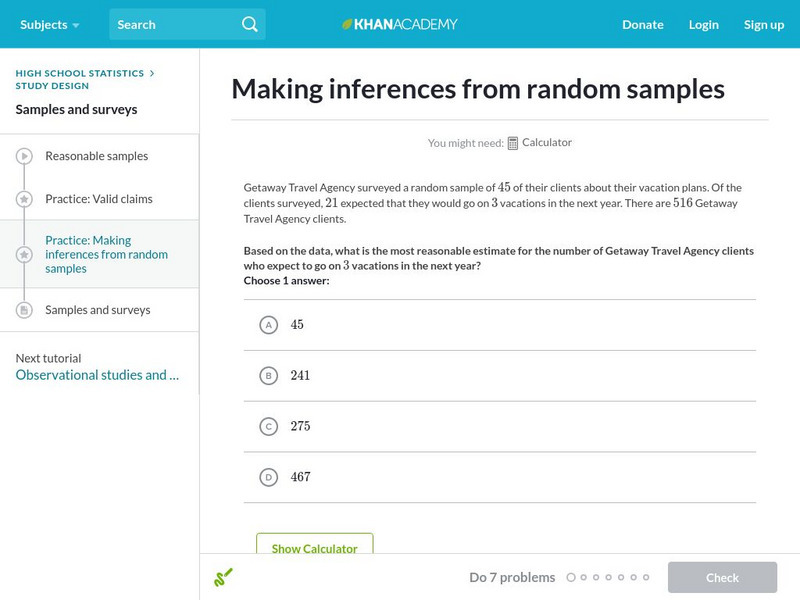
Khan Academy: Making Inferences From Random Samples
Given a random sample, practice figuring out what can we reasonably infer about the entire population? Students receive immediate feedback and have the opportunity to try questions repeatedly, watch a video or receive hints.
Texas Education Agency
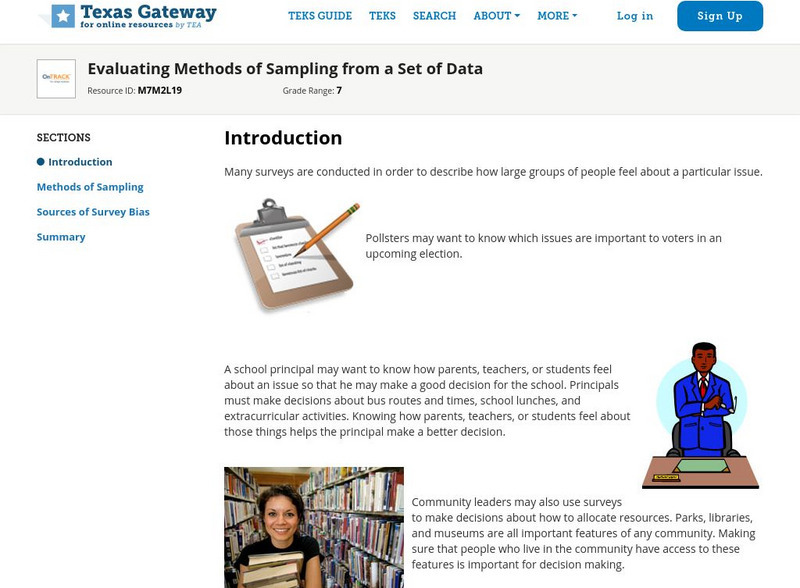
Texas Gateway: Evaluating Methods of Sampling From a Set of Data
Given a problem situation, the student will evaluate a method of sampling to determine the validity of an inference made from the set of data.
Texas Education Agency
Texas Gateway: Generalizing About Populations From Random Samples
Given a population with known characteristics, students will be able to use a variety of methods to generate random samples of the same size in order to understand how a random sample is representative of a population.
Khan Academy
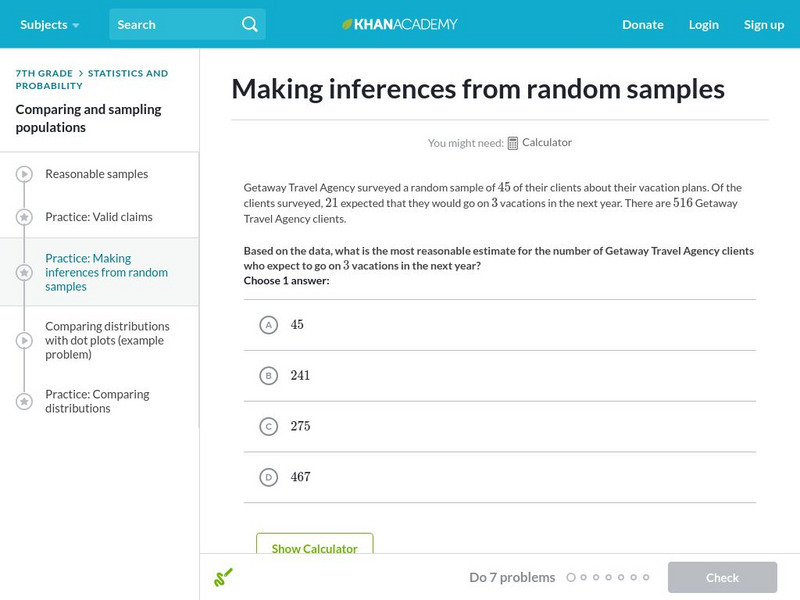
Khan Academy: Making Inferences From Random Samples
Practice making inferences from random samples.
Sophia Learning
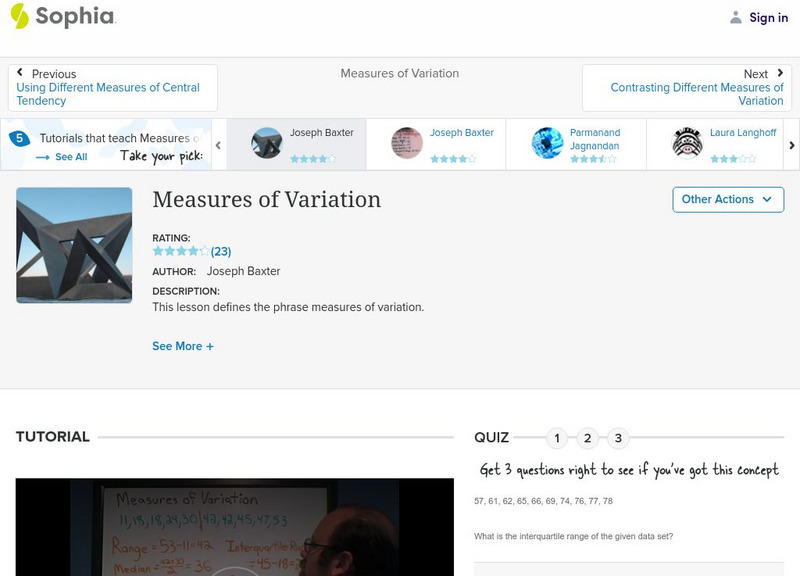
Sophia: Measure of Variation
Explore the measures of variation and check understanding with an assessment.
Web Center for Social Research Methods
Research Methods Knowledge Base: Sampling in Research
Site discusses the use of sampling in research. The key statistical terms used in sampling are linked for the user to quickly find definitions. The major concepts of probability and nonprobability are also highlighted.


