EngageNY
Why Worry About Sampling Variability?
Are the means the same or not? Groups create samples from a bag of numbers and calculate the sample means. Using the sample means as an estimate for the population mean, scholars try to determine whether the difference is real or not.
EngageNY
End-of-Module Assessment Task: Grade 7 Mathematics Module 5
Show learners how to use simulations and random sampling to reach conclusions with the last resource in a 25-part series. The assessment contains three scenarios, each with several parts, and covers comparing populations using...
EngageNY
Using Sample Data to Compare the Means of Two or More Populations II
The 23rd segment in a series of 25 presents random samples from two populations to determine whether there is a difference. Groups determine whether they believe there is a difference between the two populations and later use an...
Virginia Department of Education
Box-and-Whisker Plots
The teacher demonstrates how to use a graphing calculator to create box-and-whisker plots and identify critical points. Small groups then create their own plots and analyze them and finish by comparing different sets of data using box...
Mathematics Assessment Project
Statistics and Probability
Quickly assess basic understandings of statistics and probability. The resource contains five quick tasks from the probability and statistics domain. The questions range from finding simple conditional probabilities to measures of...
Curated OER
NFL Home Field Advantage?
Does the home team have the home field advantage in football? Class members look at a graph that displays wins at home and wins on the road for each NFL team from 2002–2012. Then they answer eight word problems that look at the...
Yummy Math
Should NFL Quarterbacks Shave or Grow a Beard?
What does facial hair have to do with quarterback ratings? Using a set of data that provides QBR with and without facial hair, football enthusiasts determine if performance is affected. It also has learners question if the relationship...
Noyce Foundation
Ducklings
The class gets their mean and median all in a row with an assessment task that uses a population of ducklings to work with data displays and measures of central tendency. Pupils create a frequency chart and calculate the mean and median....
Curated OER
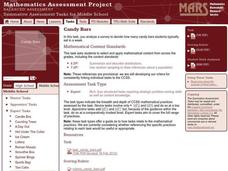
Candy Bars
There is often more to data than meets the eye. Scholars learn that they need to analyze data before making conclusions as they look at data that describes the number of candy bars boys and girls eat. They disprove a given conclusion and...
Utah Education Network (UEN)
Probability and Statistics
MAD about statistics? In the seventh chapter of an eight-part seventh-grade workbook series, learners develop probability models and use statistics to draw inferences. In addition, learners play games and conduct experiments to determine...
Curriculum Corner
7th Grade Math "I Can" Statement Posters
Translate the Common Core math standards into a series of achievable "I can" statements with this collection of classroom displays. Offering posters for each standard, this resource is a great way to support your seventh graders as...
Curriculum Corner
7th Grade Math Common Core Checklist
With so many math standards to fit into a school year, it can be difficult keeping track of what you have and have not covered. This collection of Common Core checklists allows you to maintain a running record of when each...
Curated OER
College Athletes
When more basketball players are taller than field hockey players at a school, is it safe to say that in general they are always taller? The activity takes data from two college teams and your learners will be able to answer questions...
Illustrative Mathematics
Offensive Linemen
Comparing college football teams, Division I is said to have heavier lineman than Division III. Your mathematicians are given data from two different divisions and will have to interpret a dotplot and calculate the difference in weight...
National Research Center for Career and Technical Education
Business Management and Administration: Compound Interest - A Millionaire's Best Friend
Many math concepts are covered through this resource: percentages, decimals, ratios, exponential functions, graphing, rounding, order of operations, estimation, and solving equations. Colorful worksheets and a link to a Google search for...
National Research Center for Career and Technical Education
Architecture and Construction: Stair Construction
Within the context of the construction industry, algebra pros begin to calculate slope from the sizes of stair steps. This is a terrific instructional activity, especially for aspiring engineers. Just be aware that it might be a stretch...
National Research Center for Career and Technical Education
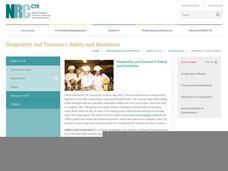
Hospitality and Tourism 1: Safety and Sanitation
Math and science come alive in this career-related lesson on sanitation. Along the way, learners explore bacterial growth rates using exponential notation and graphs. A link to a very brief, but vivid video shows just how quickly these...
Curated OER
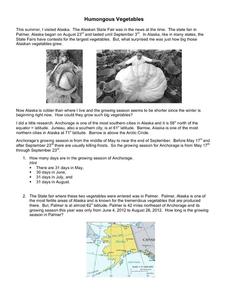
Humongous Vegetables
Humongous vegetables can inspire and awaken your mathematicians to the large math concepts in our Common Core standards. What is the secret to growing such gargantuan garden objects in Alaska? In the state that is closest to the...
Wake Forest University
Authentic Activities for Connecting Mathematics to the Real World
Check out the handout from a presentation that contains a collection of high school algebra projects connecting a variety of mathematics to the real world. Activities range from simple probabilities to calculus. The activities...
National Research Center for Career and Technical Education
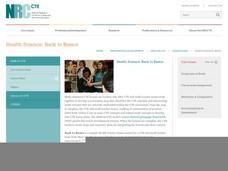
Health Science: Back to Basics
This lesson plan focuses on unit conversion, proportions, ratios, exponents, and the metric system. Discuss measurement with your math class and demonstrate how to solve several health-science word problems. Give learners a chance to...
Queensland Government
Means, Modes And Medians
Middle schoolers identify the mean, mode, and median of the heights for males and females who are age 13. They describe the difference between the three words and what each signifies. Finally, pupils fill in a table and calculate the...
Curated OER
Fit With Fiber
Sixth graders investigate the nutritional value of different types of cereal. They take a survey of students that ate breakfast and create a circle graph with the results. Students examine the nutritional information on the sides of the...
Curated OER
Fruit or Vegetable?
Watermelon is a vegetable? A tomato is a fruit? Believe it or not, this debate is decades old. Groups examine rulings by the US Supreme Court, the USDA, and state statutes before developing their own criteria to use when labeling...
Curated OER
Circles in the Landscape: Irrigating Oklahoma Crops
How do you grow crops in a area with insufficient rainfall? Why you irrigate, of course. Class members investigate irrigation systems by designing a system of their own. After examining irrigation related concepts, vocabulary terms, and...


