Curated OER
Managing Nutrients in Livestock Manure
Livestock managers reinforce math and science skills while learning about the nutrients found in manure. They predict which animal produces the largest amount and which animal's manure contains the most nitrogen. Finally, they compare...
University of South Florida
Fcat: Drops on a Penny: Teacher Notes
Young scholars learn how to create stem-and-leaf diagrams and boxplots by collecting data on the surface tension of water molecules. This hands-on activity using pennies is a great way to learn how to organize data.
Wolfram Research
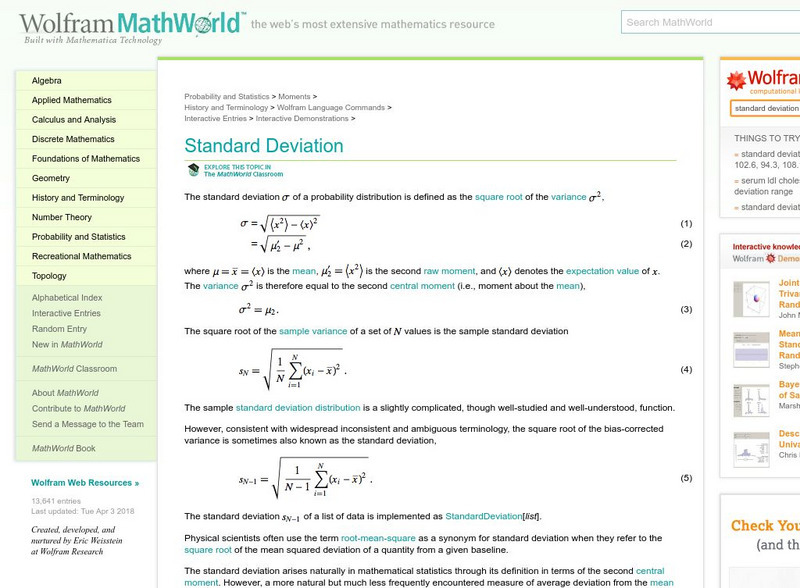
Wolfram Math World: Standard Deviation
This World of Mathematics site by Eric Weisstein explains the term "Standard deviation." Provides step-by-step help, examples, and charts.
Google
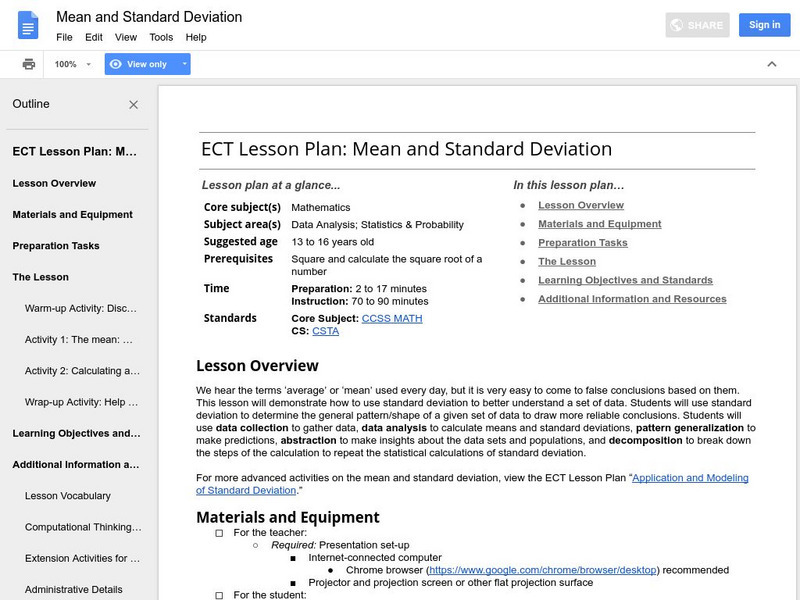
Google for Education: Mean and Standard Deviation
This lesson demonstrates to students how to use standard deviation to better understand a set of data. Students use standard deviation to determine the general pattern or shape of a given set of data to draw more reliable conclusions.
Annenberg Foundation
Annenberg Learner: Learning Math: Min, Max and the Five Number Summary
Explore how to interpret a large set of data by dividing it up into smaller portions in order to answer statistical questions.
Science Education Resource Center at Carleton College
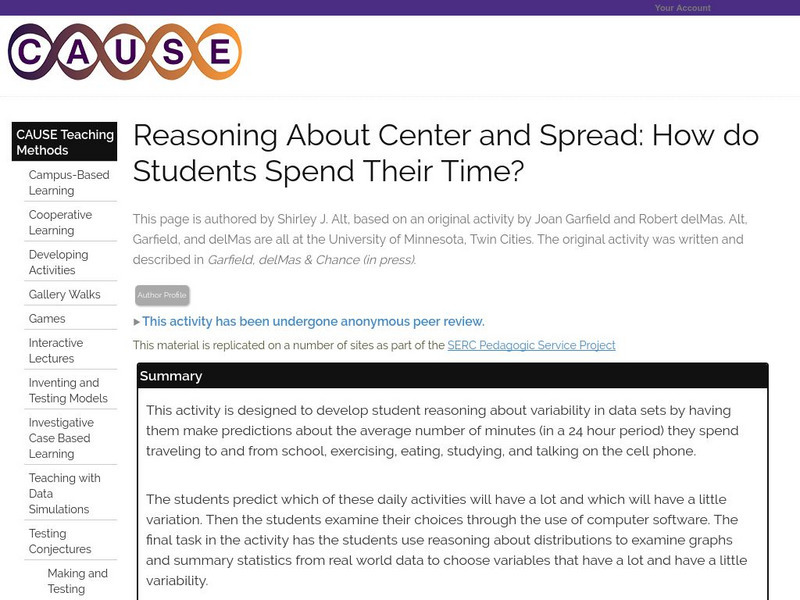
Serc: Reasoning About Center and Spread: How Do Students Spend Their Time?
Using their own habits for data, students predict how much time they spend on different activities each day, and how much variability each activity is likely to have. They then collect data into a class spreadsheet and look at the...
Oswego City School District
Regents Exam Prep Center: Scatter Plots and Line of Best Fit
Use this lesson, practice exercise, and teacher resource in planning instruction on scatter plots and line of best fit. In the lessons, you'll find definitions and examples of ways to make a scatter plot, determine correlations, and find...
Education Development Center
Math Partners: Statistics and Probability [Pdf]
Comprehensive unit that consists of lessons and activities designed to help students learn statistics and probability concepts.
University of Texas
Inside Mathematics: Baseball Players [Pdf]
This task challenges students to demonstrate understanding of the concept of measure of center.
US Census Bureau
Us Census: Percentage of People Who Walk to Work in Cities and Population Size
Using census data, learners will create box plots to make inferences about the percentages of people who walk to work in cities of different population sizes (small, medium, and large). Students will use these findings to write a short...
Thinkport Education
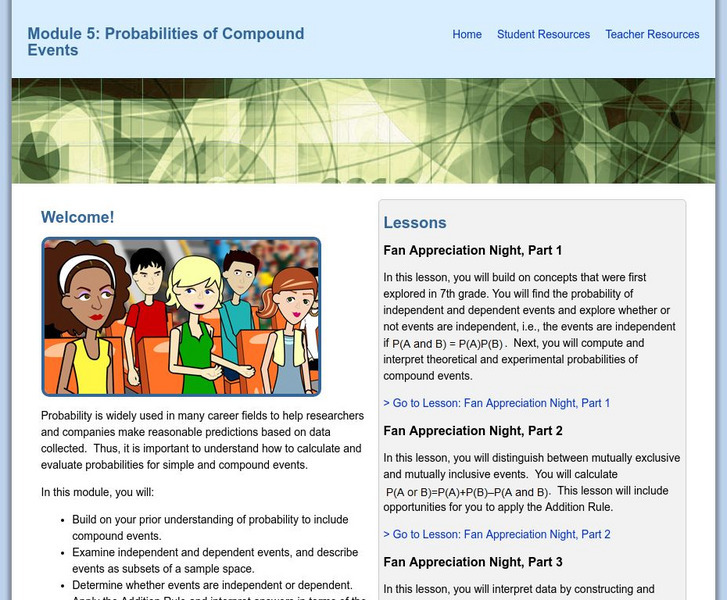
Thinkport: Algebra Ii: Probabilities of Compound Events
A module for students to build on prior understanding of probability to include compound events; examine independent and dependent events, and describe events as subsets of a sample space,; determine whether events are independent or...
Thinkport Education
Thinkport: Algebra Ii: Inferences
Focus on the development and collection of data, emphasizing the importance of simple random sampling.
Math Drills
Math Drills: Statistics and Probability Worksheets
Download these free worksheets to sharpen your skills with statistics and probability. Sheets focus on collecting and organizing data, measures of central tendency (mean, median, mode, and range), and probability.
Cuemath
Cuemath: Outlier
A comprehensive guide for exploring the topic of outliers with definitions, what is an outlier, how to find outliers using the turkey method and the interquartile range, solved examples, and interactive questions.
Cuemath
Cuemath: Measures of Central Tendency
A comprehensive guide for learning all about measures of central tendency with definitions of mean, median, and mode, solved examples, and practice questions.
Concord Consortium
Seeing Math: Plop It
Plop It! lets you experiment with the concepts of mean, median, and mode (measures of center). You see the differences among them on a bar graph, as you add or remove blocks to an axis with a given range.
Houghton Mifflin Harcourt
Holt, Rinehart and Winston: Homework Help Independent Practice: Measures of Central Tendency
Get independent practice working with the mean, median and mode. Each incorrect response gets a text box explanation and another try. Correct responses are confirmed.
Houghton Mifflin Harcourt
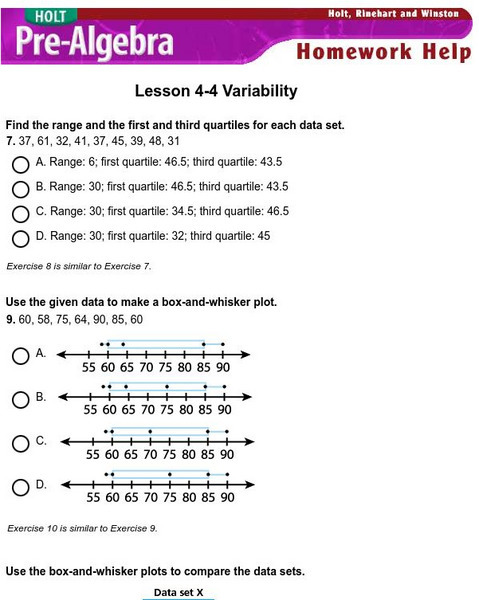
Holt, Rinehart and Winston: Homework Help Independent Practice: Variability
Get independent practice working with variability. Each incorrect response gets a text box explanation and another try. Correct responses are confirmed.
AAA Math
Aaa Math: Central Tendencies Notes
A complete description of mean, median and mode. Interactive games and practice exercises are included.
University of Regina (Canada)
University of Regina: Math Central: Central Tendency Activity
An Internet activity that creates data to be evaluated using statistics skills such as central tendency, data analysis, and graphing. The topic of the exercise is the average height of a student's class.
University of Regina (Canada)
University of Regina: Math Central: Scatter Plots
Three different concepts are examined about scatter plots. Topics featured are collecting data, analyzing scatter plots, and determining a line of "best fit". The lesson has an overview, material, procedures, and evaluation techniques.
University of Georgia
University of Georgia: Definitions in Statistics
This site contains definitions to use in statistics and ways to collect data.
University of Georgia
University of Georgia: Measures of Variation
Lesson plan introduces and explains how to calculate measures of variation concepts such as range and quartile.


