Ed Migliore
Linear Equations in Two Variables
This traditional textbook style unit includes vocabulary, a direct explanation section, examples, practice problems that directly line up with the explanations and examples, and a unit summary review and practice problems. Learners get...
Blogger
Slope Intercept Form (y=mx+b) Foldable
Each piece of the y=mx+b formula represents something important about graphing. Take those important ideas and connect them to each part of the formula with notes or examples underneath each tab representing y, m, x,...
Illustrative Mathematics
Introduction to Linear Functions
Introduce your algebra learners to linear and quadratic functions. Learners compare the differences and relate them back to the equations and graphs. Lead your class to discussions on the properties of a function or a constant slope...
Illustrative Mathematics
Modeling with a Linear Function
Here is a well-designed resource that provides five yes-or-no questions which model different situations with linear functions. It makes a good pre-test for the beginning of the unit. The purpose is to elicit common misconceptions of...
Curated OER
Heart Rate Monitoring
Algebra learners like this resource because it is easy to understand and it relates to their lives. Whether you are starting a new workout routine, or just climbing the stairs, your heart rate increases and decreases throughout the day....
Gatsby Charitable Foundation
Four Activities Using Straight Line Graphs
This math packet includes four different activities which puts linear equations and line of best fit in the context of real world applications. Each activity uses a different linear math modeling equation and asks the learners to...
Curated OER
Graphs and Functions
Middle schoolers describe plotting functions on the Cartesian coordinate plane. They solve functions on paper and using an online tool to plot points on a Cartesian coordinate plane creating lines and parabolas.
Education Institute
Four Mathematics Lessons for Grade 9
These four lesson plans build algebra skills for working with numbers in exponential form and for examining triangles. Be aware that in the text, scientific notation is referred to as index notation and the laws of exponents as the laws...
Alabama Learning Exchange
Human Slope
Middle and high schoolers explore the concept of slope. For this slope lesson, learners graph lines using a life-size graph. They use chalk on a blacktop to create a coordinate plane and use each other as the tick marks on the grid....
Saxon
Plotting Functions
Youngsters use a graphing calculator to assist in creating a function table. They graph the function on a coordinate plane. They explore the relationship between the domain and range in the graph. This four-page activity contains two...
CPM
Tables, Equations, and Graphs
Eighth and ninth graders solve and graph 24 different problems that include completing input/output tables and graphing the pairs. First, they find the missing values for each table and write the rule for x. Then, students write the...
Curated OER
The Cartesian Plane
Learners solve and complete 22 various types of problems. First, they find the gradients of the lines and plot the given points. Then, they complete the table of values for each equation and use the table to draw the graph.
National Research Center for Career and Technical Education
Health Science: Back to Basics
This lesson plan focuses on unit conversion, proportions, ratios, exponents, and the metric system. Discuss measurement with your math class and demonstrate how to solve several health-science word problems. Give learners a chance to...
Curated OER
Graphing Linear Equations Cards
OK, so maybe graphing linear equations can be fun. This activity includes a set of linear equation cards to be cut and place face up on a table. Learners pick a card and match it to the correct graph card. This is a really fun way to...
CPM
Unit 3, Worksheet 1, Exponents and Algebraic Expressions
Need exponentt practice? Then this exponent worksheet will be helpful to have learners evaluate exponent expressions and algebraic expressions. They use the distributive property to solve equations. This three-page worksheet contains...
Curated OER
FCAT Real World Solving Linear Equations/Systems
Pupils relate real life situation to the equations, graphs and inequalities. They model real life scenarios using matrices and draw conclusions from their data. This lesson plan is aligned with FCAT.
Curated OER
Getting Started with the TI-Navigator™ System: What's My Line?
Learners analyze linear functions in this algebra lesson. They explore the meaning of slope and the slope-intercept form of a line as they investigate the effect changing parameters on the graph of a linear function.
Alabama Learning Exchange
Graphing Stations
Students explore the concept of graphing stations. In this graphing stations instructional activity, students head to various teacher set-up stations involving slope, point-slope, standard form, parallel lines, etc. Students...
Shodor Education Foundation
Shodor Interactivate: Lesson: Introduction to Functions
Input numbers into the function machine and explore independent and dependent variables.
University of South Florida
Fcat: Spaghetti Bridges: Teacher Notes
Students build bridges and test their strength to collect data and write an equation. The concept of slope is explored in this activity.
Texas Instruments
Texas Instruments: Explore Graphs and Factors
Students use a graphing calculator to explore the relationship between the linear factors of a quadratic function and its zeros. They learn that the x-intercepts and axis of symmetry of a quadratic function can be determined from its...
Other
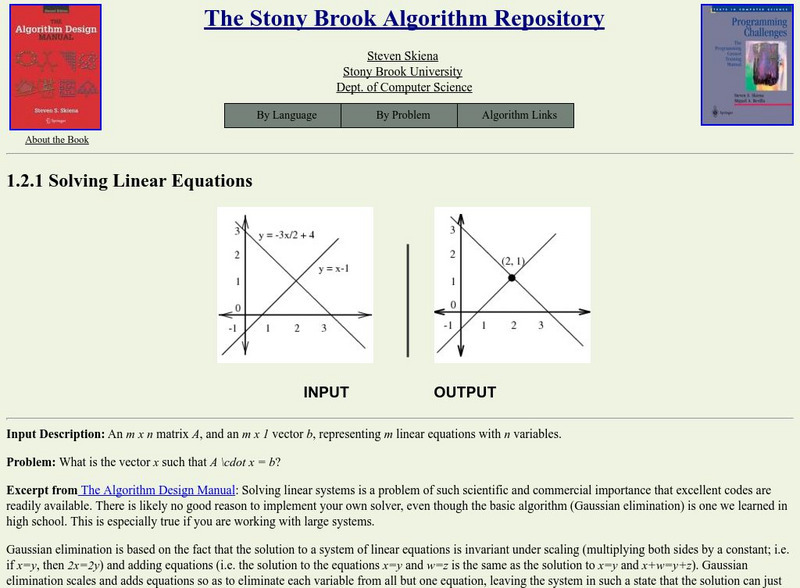
Stony Brook University: Solving Linear Equations
The name linear comes from the fact that such an equation in two unknowns or variables represents a straight line. A set of such equations is called a system. This site explains all this and more.
University of Colorado
University of Colorado: Ph Et Interactive Simulations: Graphing Lines
Explore the world of lines. Investigate the relationships between linear equations, slope, and graphs of lines.
Texas Education Agency
Texas Gateway: Determining Slopes From Equations, Graphs, and Tables
Given algebraic, tabular, and graphical representations of linear functions, the student will determine the slope of the relationship from each of the representations.


