Curated OER
Math TODAY for TI-Navigator System - Humidity Makes Air Feel Even Hotter ? Part II
Learners explore quadratic and cubic functions that will model the relationship between air temperature and heat index at fixed relative humidity values. They also make generalizations and apply the findings using their TI-83 Plus or...
Curated OER
A Tough Nut to Crack
Children, based on a set of criteria, evaluate the quality of pecans. They research recorded history of pecan trees as well as how their seeds moved across western Missouri into southeastern Kansas, Oklahoma, Texas and Mexico. In...
Curated OER
Circles in the Landscape: Irrigating Oklahoma Crops
How do you grow crops in a area with insufficient rainfall? Why you irrigate, of course. Class members investigate irrigation systems by designing a system of their own. After examining irrigation related concepts, vocabulary terms, and...
Alabama Learning Exchange
The State Capital of Stem and Leaf
Students explore the concept of stem and leaf plots. In this stem and leaf plots lesson plan, students plot the 50 US states' capitals on a stem and leaf plot according to the first letter of each state. Students compare their stem and...
Curated OER
Managing Nutrients in Livestock Manure
Livestock managers reinforce math and science skills while learning about the nutrients found in manure. They predict which animal produces the largest amount and which animal's manure contains the most nitrogen. Finally, they compare...
Curated OER
Storefront Signs
Learners practice finding the areas and patterns within a square and explore the concept of quadratic functions. They observe and record the area values in a table, plot a graph of Area versus Distance and complete a variety of student...
University of South Florida
Fcat: Drops on a Penny: Teacher Notes
Young scholars learn how to create stem-and-leaf diagrams and boxplots by collecting data on the surface tension of water molecules. This hands-on activity using pennies is a great way to learn how to organize data.
Google
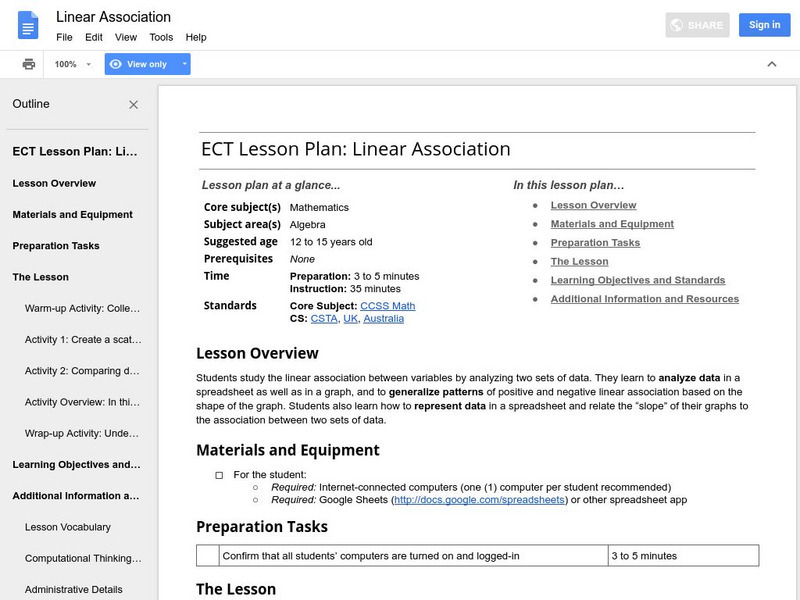
Google for Education: Linear Association
This student activity allows for practice in graphing data in a spreadsheet and relate the "slope" of their graphs to the association between two sets of data.
Annenberg Foundation
Annenberg Learner: Learning Math: Min, Max and the Five Number Summary
Explore how to interpret a large set of data by dividing it up into smaller portions in order to answer statistical questions.
University of Colorado
University of Colorado: Ph Et Interactive Simulations: Least Squares Regression
Create your own scatter plot or use real-world data and try to fit a line to it. Explore how individual data points affect the correlation coefficient and best-fit line.
Oswego City School District
Regents Exam Prep Center: Scatter Plots and Line of Best Fit
Use this lesson, practice exercise, and teacher resource in planning instruction on scatter plots and line of best fit. In the lessons, you'll find definitions and examples of ways to make a scatter plot, determine correlations, and find...
Texas Education Agency
Texas Gateway: Analyzing Scatterplots
Given a set of data, the student will be able to generate a scatterplot, determine whether the data are linear or non-linear, describe an association between the two variables, and use a trend line to make predictions for data with a...
Cuemath
Cuemath: Linear Graph
A comprehensive guide for learning all about linear graphs with definitions, properties, their equations, how to plot or analyze them, solved examples, and practice questions.
Cuemath
Cuemath: Scatter Plot
A comprehensive guide for learning all about scatter plots with definitions, how to construct and solve them, types of scatter plots, solved examples, and practice questions.
Scholastic
Scholastic: Shake, Rattle & Roll
Middle schoolers will learn and reinforce skills for creating and analyzing scatterplots and histograms; using cost-benefit analysis to make predictions from data and using tree diagrams to understand outcomes of events.
Houghton Mifflin Harcourt
Holt, Rinehart and Winston: Homework Help Independent Practice: Scatter Plots
Get independent practice working with scatter plots. Each incorrect response gets a text box explanation and another try. Correct responses are confirmed.
Duke University
Duke University: Introduction to Linear Regression
This page discusses linear regression, its equations, background, and applications. Provides questions, answers, formulas, and explanations for understanding.
University of Regina (Canada)
University of Regina: Math Central: Scatter Plots
Three different concepts are examined about scatter plots. Topics featured are collecting data, analyzing scatter plots, and determining a line of "best fit". The lesson has an overview, material, procedures, and evaluation techniques.
University of Illinois
University of Illinois: Scatter Plots and Correlations
This site gives information on scatter plots, along with examples showing high positive correlation, low negative correlation, high negative correlation, no correlation, and low positive correlation.
University of South Florida
Florida Center for Instructional Tech: Famous People
Students estimate the ages of famous people, then create a scatterplot with the actual ages. This activity allows them to estimate with linear equations. You can access the age data through the "activity" link.
University of Georgia
University of Georgia: Definitions in Statistics
This site contains definitions to use in statistics and ways to collect data.
Shodor Education Foundation
Shodor Interactivate: Interactive: Scatter Plot
Use this interactive applet to input a series of (x, y) ordered pairs and plot them. Parameters such as minimum and maximum value, minimum and maximum y value, and x- and y-scale can be set by the user or determined by the applet.
Shodor Education Foundation
Shodor Interactivate: Outliers
Explore what outliers are with this interactive activity.


