Other
Northern Michigan University: Line Plots
The author utilizes a line plot to demonstrate what an "outlier" is, what "clusters" are, and what "gaps" are.
Varsity Tutors
Varsity Tutors: Hotmath: Algebra Review: Line Plot
Find a quick, concise explanation of a line plot. An example is given and clearly explained.
Shmoop University
Shmoop: Basic Statistics & Probability: Box & Whisker Plots
Students learn about box and whisker plots. Notes, examples, and practice exercises are included in the statistics resource.
Shmoop University
Shmoop: Basic Statistics & Probability: Scatter Plots & Correlation
The statistics resource explores scatter plots and correlation. Students learn about the concepts through notes and detailed examples. The resource consists of practice exercises to check for comprehension of the topics.
That Quiz
That Quiz: Graficas
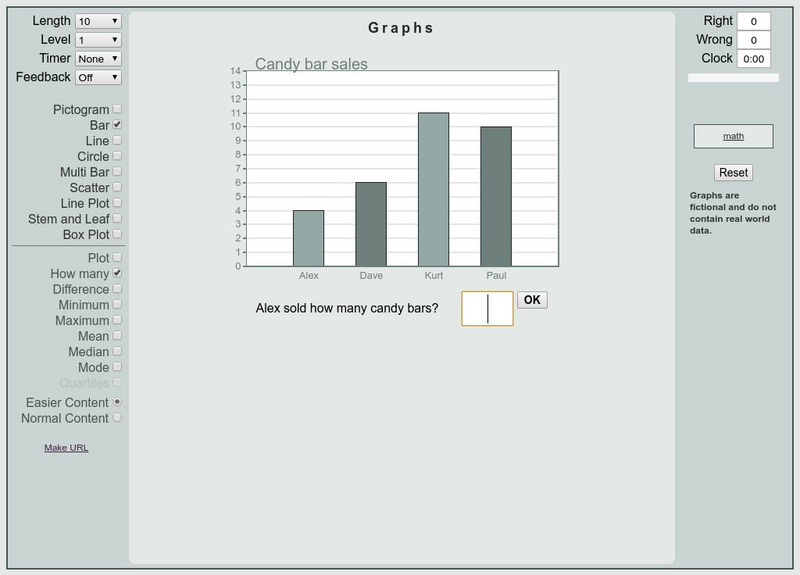
This is an interactive practice to review bar graphs, circle graph, scatter plot, etc. Test are timed and keep track of right and wrong answers. Different levels of difficulties are provided.
Varsity Tutors
Varsity Tutors: Hotmath: Algebra Review: Scatter Plots
Find a quick, concise explanation of what a scatter plot is. Several examples are given and clearly explained.
Varsity Tutors
Varsity Tutors: Hotmath: Practice Problems: Scatter Plots
Six problems present various aspects of using scatter plots. They are given with each step to the solution cleverly revealed one at a time. You can work each step of the problem then click the "View Solution" button to check each step of...
National Council of Teachers of Mathematics
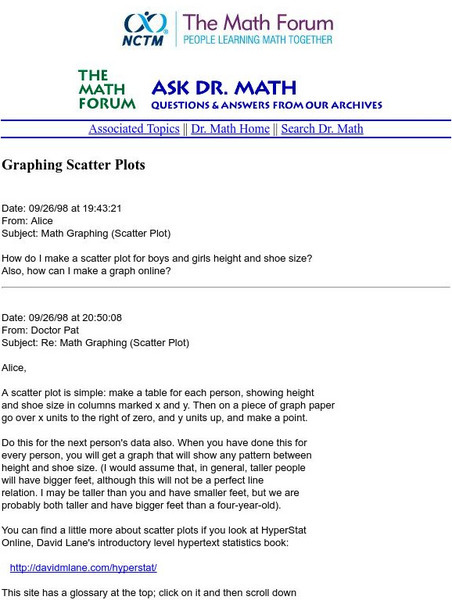
The Math Forum: Nctm: Ask Dr. Math: Graphing Scatter Plots
This page is in response to a question that someone emailed Dr. Math. It shows how to make a scatter plot for peoples' height and shoe sizes. The information is somewhat brief, but worth checking out on the subject.
National Council of Teachers of Mathematics
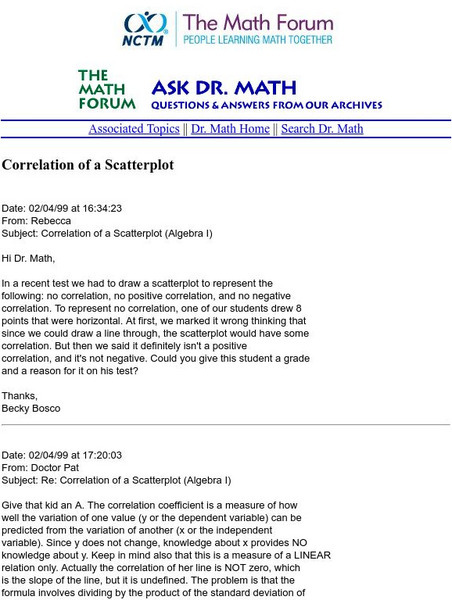
The Math Forum: Nctm: Ask Dr. Math: Correlation of a Scatterplot
This page from Ask Dr. Math describes the correlation of a scatterplot and gives an example of one with no correlation.
Palomar Community College District
Palomar College: Scatter Plot
This site, which is provided for by the Palomar College, gives a sample problem of how to graph a scatter plot, including the appropriate axes.
University of Illinois
University of Illinois: Rollin' Rollin' Rollin'
This resource is the beginning of a series of pages that demonstrates the diffference between the mean and median of a group of numbers. Uses bar graphs to display the data.


