Illustrative Mathematics
Illustrative Mathematics: 8.sp Birds' Eggs
A scatter plot showing data for the sizes of birds' eggs is presented. Students are to look for correlations and make predictions whose values fall within the data range. They are also to make generalizations about the characteristics of...
Illustrative Mathematics
Illustrative Mathematics: 8.sp Laptop Battery Charge
This task looks at how long it takes for a laptop battery to fully charge. Students make a scatter plot of data, draw a 'line of best fit,' and predict the time it will take to reach a full charge. Aligns with 8.SP.A.2.
CK-12 Foundation
Ck 12: Algebra: Fitting Lines to Data
[Free Registration/Login may be required to access all resource tools.] Learn how to write equations of best fit lines.
CK-12 Foundation
Ck 12: Statistics: Scatter Plots and Linear Correlation
[Free Registration/Login may be required to access all resource tools.] In this tutorial, students learn how to interpret data through the use of a scatter plot.
Texas A&M University
Wtamu Virtual Math Lab: Beginning Algebra: Graphing Linear Inequalities
A tutorial on how to graph a linear inequality in two variables. The tutorial offers step-by-step instruction and examples of how to graph linear inequalities.
National Council of Teachers of Mathematics
Nctm: Illuminations: Line of Best Fit
Use this activity to practice how to enter a set of data, plot the data on a coordinate grid, and determine the equation for a line of best fit.
National Council of Teachers of Mathematics
Nctm: Illuminations: Linear Regression I
This applet allows you to investigate a regression line, sometimes known as a "line of best fit."
Shodor Education Foundation
Shodor Interactivate: Linear Inequalities
Students create linear inequalities and systems of linear inequalities on a coordinate plane. This is like a graphing calculator with advanced viewing options.
Shodor Education Foundation
Shodor Interactivate: Regression
Plot a bivariate data set, determine the line of best fit for their data, and then check the accuracy of your line of best fit.
Shodor Education Foundation
Shodor Interactivate: Scatter Plot
Graph ordered pairs and customize the graph title and axis labels. Points are connected from left to right, rather than being connected in the order they are entered.
Shodor Education Foundation
Shodor Interactivate: Linear Regression and Correlation
Students are introduced to correlation between two variables and the line of best fit.
Quia
Ixl Learning: Line of Best Fit
Brush up on your math skills relating to the line of best fit then try some practice problems to test your understanding.
Quia
Ixl Learning: Scatter Plots
Brush up on your math skills relating to scatter plots then try some practice problems to test your understanding.
National Council of Teachers of Mathematics
Nctm: Figure This: Does It Make a Difference Where You Shop?
A math investigation that uses scatter plots to compare prices of favorite soft drinks. Discover how valuable your skills in organizing and displaying data can be in real life scenarios.
Shodor Education Foundation
Shodor Interactivate: Simple Plot
A java applet that helps a student to create a scatter plot using the coordinates and axes and given data.
Other
Northern Michigan University: Line Plots
The author utilizes a line plot to demonstrate what an "outlier" is, what "clusters" are, and what "gaps" are.
ClassFlow
Class Flow: Patterns Graphs
[Free Registration/Login Required] In this lesson students will understand linear relations and functions. They will create graphs and analyze graphs of linear equations.
Varsity Tutors
Varsity Tutors: Hotmath: Algebra Review: Line Plot
Find a quick, concise explanation of a line plot. An example is given and clearly explained.
ClassFlow
Class Flow: Linear Models
[Free Registration/Login Required] This flipchart explores both linear models and scatter plots.
Shmoop University
Shmoop: Basic Statistics & Probability: Scatter Plots & Correlation
The statistics resource explores scatter plots and correlation. Students learn about the concepts through notes and detailed examples. The resource consists of practice exercises to check for comprehension of the topics.
That Quiz
That Quiz: Graficas
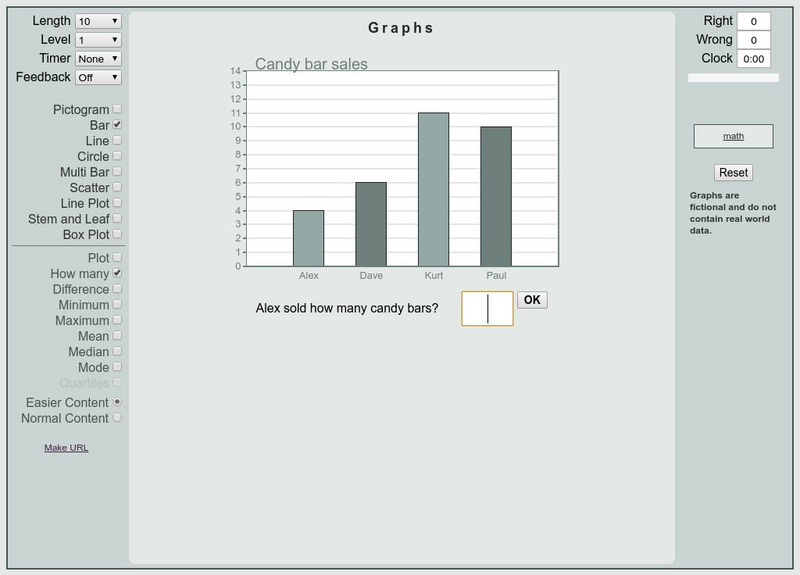
This is an interactive practice to review bar graphs, circle graph, scatter plot, etc. Test are timed and keep track of right and wrong answers. Different levels of difficulties are provided.
Varsity Tutors
Varsity Tutors: Hotmath: Algebra Review: Scatter Plots
Find a quick, concise explanation of what a scatter plot is. Several examples are given and clearly explained.
Varsity Tutors
Varsity Tutors: Hotmath: Practice Problems: Scatter Plots
Six problems present various aspects of using scatter plots. They are given with each step to the solution cleverly revealed one at a time. You can work each step of the problem then click the "View Solution" button to check each step of...
National Council of Teachers of Mathematics
The Math Forum: Nctm: Ask Dr. Math: Graphing Scatter Plots
This page is in response to a question that someone emailed Dr. Math. It shows how to make a scatter plot for peoples' height and shoe sizes. The information is somewhat brief, but worth checking out on the subject.


