National Research Center for Career and Technical Education
Architecture and Construction: Stair Construction
Within the context of the construction industry, algebra pros begin to calculate slope from the sizes of stair steps. This is a terrific lesson, especially for aspiring engineers. Just be aware that it might be a stretch to meet all of...
National Research Center for Career and Technical Education
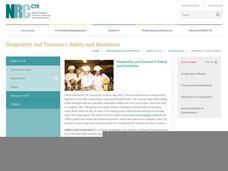
Hospitality and Tourism 1: Safety and Sanitation
Math and science come alive in this career-related instructional activity on sanitation. Along the way, learners explore bacterial growth rates using exponential notation and graphs. A link to a very brief, but vivid video shows just how...
Gatsby Charitable Foundation
Four Activities Using Straight Line Graphs
This math packet includes four different activities which puts linear equations and line of best fit in the context of real world applications. Each activity uses a different linear math modeling equation and asks the learners to...
Curated OER
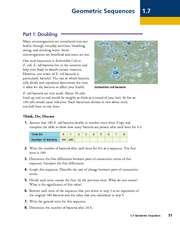
Geometric Sequences - Bacterial Growth
Bring algebra to life with scientific applications. Math minded individuals calculate and graph the time it takes a bacterium to double. They discuss geometric sequences and use a chart to graph their findings. There are 38 questions all...
Math Worksheets Land
Patterns of Association (Using Data Table) - Matching Worksheet
This resource is the last of a four-part series that practices calculating percents based on data represetned in tables. This page has four multiple choice problems that analyze the data tables to answer a question.
Math Worksheets Land
Patterns of Association (Using Data Tables) - Independent Practice Worksheet
Here is a activity that belongs in a four-part resource that has learners practice using data tables to calculate percentages. The page has ten problems with different data tables asking to find different percents.
Math Worksheets Land
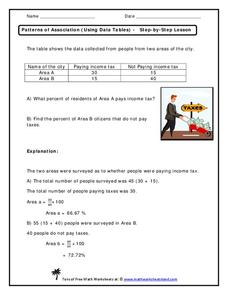
Patterns of Association (Using Data Tables) - Step-by-Step Lesson
This worksheet belongs to a four-part resource that gathers information from data tables to calculate percentages. The page introduces one problem and shares an explanation to the answer.
National Research Center for Career and Technical Education
Health Science: Back to Basics
This lesson focuses on unit conversion, proportions, ratios, exponents, and the metric system. Discuss measurement with your math class and demonstrate how to solve several health-science word problems. Give learners a chance to visit an...
Curated OER
Oklahoma Stone Soup
Class members complete activities related to the story "Oklahoma Stone Soup." First, pupils read, discuss, and answer questions about the story. Next, to incorporate math into the lesson, learners make stone soup using a variety of...
PBS
Pbs Learning Media: Restocking Shoes
In this video from Cyberchase, Bianca uses data on past shoe sales to help her decide what quantities of each size she should order in the next shipment.
Science Education Resource Center at Carleton College
Serc: Reasoning About Center and Spread: How Do Students Spend Their Time?
Using their own habits for data, young scholars predict how much time they spend on different activities each day, and how much variability each activity is likely to have. They then collect data into a class spreadsheet and look at the...
Oswego City School District
Regents Exam Prep Center: Displaying Data
Use this lesson, practice exercise, and teacher resource in planning instruction on displaying data. In the lessons, you'll find definitions and examples of ways to collect and organize data, quartiles, and box-and-whisker plots, as well...
Texas Education Agency
Texas Gateway: Analyzing Scatterplots
Given a set of data, the student will be able to generate a scatterplot, determine whether the data are linear or non-linear, describe an association between the two variables, and use a trend line to make predictions for data with a...
Cuemath
Cuemath: Mean, Median and Mode
A comprehensive guide for learning all about mean, median, and mode with definitions, the relation between them, solved examples, and practice questions.
Cuemath
Cuemath: Frequency Distribution Table
A comprehensive guide for learning all about frequency distribution tables with definitions, how to create a frequency distribution table, and the formulas and graphs related to frequency distributions. With solved examples and...
Cuemath
Cuemath: Discrete Data
A comprehensive guide for learning all about discrete data with definitions, the difference between discrete and continuous data, graphical representation of discrete data through visualization, solved examples, and interactive questions...
University of Illinois
University of Illinois: Scatter Plots and Correlations
This site gives information on scatter plots, along with examples showing high positive correlation, low negative correlation, high negative correlation, no correlation, and low positive correlation.
Wolfram Research
Wolfram Math World: Histogram
This MathWorld site offers a clear definition and examples of a histogram.
University of Georgia
University of Georgia: Definitions in Statistics
This site contains definitions to use in statistics and ways to collect data.
Texas Instruments
Texas Instruments: How Do You Measure Up?
In this activity, students graph scatter plots to investigate possible relationships between two quantitative variables. They collect data and analyze several sets of data pairing the two quantities.
McGraw Hill
Glencoe: Two Way Tables [Pdf]
This portion of an online textbook provides examples of two-way tables, vocabulary and practice problems.
PBS
Pbs Teachers: Weather: Rainfall
Create and use scatterplots based on information from a table, and compare and contrast annual rainfall in various places around the world.
University of Cambridge
University of Cambridge: Maths and Sports: Charting Success
Sports statisticians, trainers and competitors create graphs, charts and diagrams to help them to analyse performance, inform training programmes or improve motivation. This activity encourages students to consider and analyse...
University of Cambridge
University of Cambridge: Maths and Sports: Who's the Best?
Can you use data from the 2008 Beijing Olympics medal tables to decide which country has the most naturally athletic population? This data-handling activity encourages mathematical investigation and discussion and is designed to be...









![Glencoe: Two Way Tables [Pdf] eBook Glencoe: Two Way Tables [Pdf] eBook](https://content.lessonplanet.com/knovation/original/108238-00003273f53572e51290174e1a53eb12.jpg?1661187814)

