Quia
Ixl Learning: Scatter Plots
Brush up on your math skills relating to scatter plots then try some practice problems to test your understanding.
PBS
Pbs Learning Media: Graphs, Charts, and Tables: Targeted Math Instruction
At the end of this lesson plan about graphs, charts, and tables, students will be able to interpret and compare data from graphs (including circle, bar, and line graphs), charts, and tables.
Other
Siyavula: Textbooks: Mathematics Grade 11: Probability: Tree Diagrams
Learn what a tree diagram is and how to solve a word problem while using one. View the solution steps and examples for three different problems. Then practice by solving four word problems on your own and checking the answers to see how...
Richland Community College
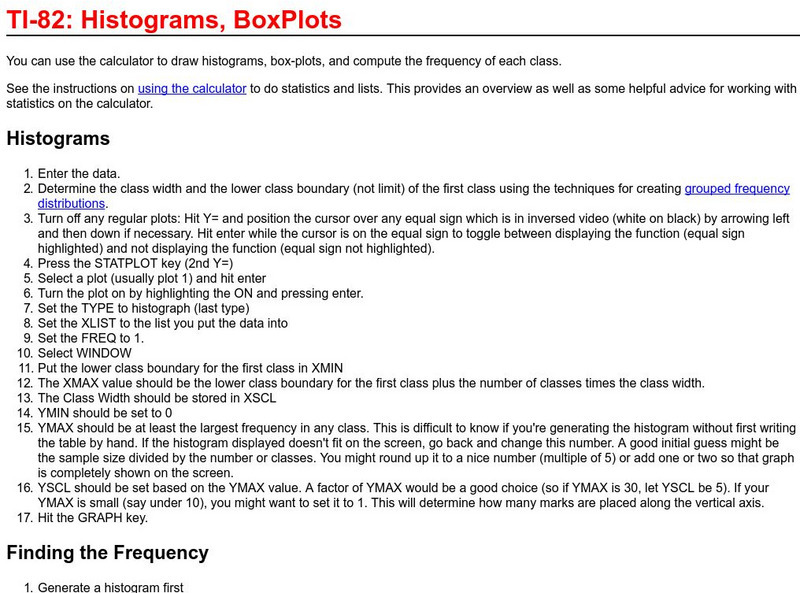
Richland College: Ti 82 Histograms / Box Plots
Richland College provides a step-by-step procedure on how to use a TI-82 to construct histograms and box plots and then use this to find frequency distribution.
Math Graphs
Houghton Mifflin: Math Graphs: Interpreting a Graph 1 [Pdf]
Students identify or sketch quantities using a given graph. The resource consists of an enlarged printable version of a math graph available in PDF format.
Math Graphs
Houghton Mifflin: Math Graphs: Interpreting a Graph 2 [Pdf]
Students identify or sketch quantities using a given graph. The resource consists of an enlarged printable version of a math graph available in PDF format.
Math Graphs
Houghton Mifflin: Math Graphs: Interpreting a Graph [Pdf]
Students use a given graph to identify and sketch different quantities. The math graph is available in PDF format.
Math Graphs
Houghton Mifflin: Math Graphs: Interpreting a Graph 3 [Pdf]
Students identify or sketch quantities using a given graph. The resource consists of an enlarged printable version of a math graph available in PDF format.
ClassFlow
Class Flow: Analyzing Data Mean, Median and Mode
[Free Registration/Login Required] Explores ways of analyzing data in a table.
ClassFlow
Class Flow: Types of Graphs
[Free Registration/Login Required] This flipchart explores the use of graphs. Bar graphs, tables and circle graphs are discussed.
ClassFlow
Class Flow: Graphing Inequalities
[Free Registration/Login Required] Students represent functional relationships using tables, equations, and graphs, and describe the connection among these representations.
ClassFlow
Class Flow: Graphs Questions
[Free Registration/Login Required] In this Flipchart, student's knowledge of reading graphs is assessed.
ClassFlow
Class Flow: Matchstick Puzzles
[Free Registration/Login Required] In this Flipchart, students use logic and mathematical reasoning to visually solve problems using matchsticks. Students develop their sense of pattern recognition, and pattern disruption, and then apply...
Shmoop University
Shmoop: Basic Algebra: Solving Multiple Equations by Graphing
The tutorial discusses how to solve multiple equations by graphing. Learners explore the concept through notes and examples. Practice problems are included to check for comprehension of the algebra topic.
That Quiz
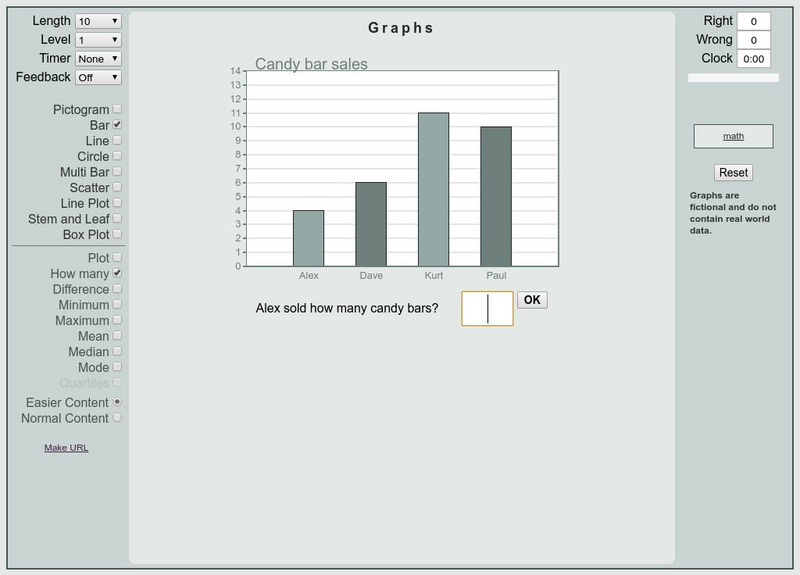
That Quiz: Graficas
This is an interactive practice to review bar graphs, circle graph, scatter plot, etc. Test are timed and keep track of right and wrong answers. Different levels of difficulties are provided.
Varsity Tutors
Varsity Tutors: Hotmath: Practice Problems: Tables and Graphs
Six problems present various aspects of using and making tables and graphs to display statistics. They are given with each step to the solution cleverly revealed one at a time. You can work each step of the problem then click the "View...
Ducksters
Ducksters: Kids Math: Picture Graphs
Math picture graphs for kids. Pie, line, and bar charts. Learn with problems, examples.


