Curated OER
Visualizing Vectors
Investigate vectors in standard positions and use the CellSheet application on the TI calculator to find the sum of two vectors. Convert from polar to rectangular coordinates and vice versa, and show graphs of the vectors.
National Research Center for Career and Technical Education
Health Science: Back to Basics
This lesson focuses on unit conversion, proportions, ratios, exponents, and the metric system. Discuss measurement with your math class and demonstrate how to solve several health-science word problems. Give learners a chance to visit an...
Center Science Education
Weather and Climate Data Exploration
Access local temperature data online, graph averages, and critique it. Learners listen to a scenario where weather and climate are confused, and then answer questions to differentiate the two. The lesson itself is compact, but there is a...
Illustrative Mathematics
How Much is a Penny Worth?
Are pennies really worth one cent? Here, learners use rates to calculate the price per pound of copper that would result in pennies that are exactly one cent's worth of copper. Might work best as a group or whole-class activity since the...
Alabama Learning Exchange
Cosmic Measurements
Students develop two units of measurement to relate to the astronomical unit and the light year. In this astronomy lesson, students use a Twizzler to develop a measurement unit similar to the astronomical unit. They use a moving object,...
Alabama Learning Exchange
Density
Students observe a demonstration of regular soda versus diet soda. In this exploring density instructional activity students complete a lab on density and present a PowerPoint presentations of their results.
Massachusetts Institute of Technology
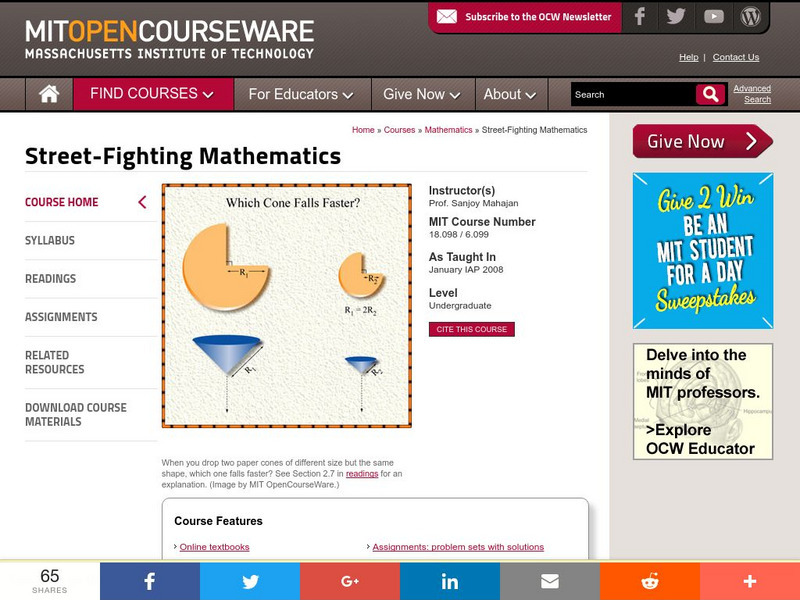
Mit: Open Course Ware: Street Fighting Mathematics
Students learn how to solve problems without doing a proof or exact calculation. Topics include dimensional analysis, successive approximation, generalization, and pictorial analysis. A syllabus, readings, assignments, and related...
Georgetown University
Georgetown: Lesson Plan: Trivial Pursuits and Algebra
Students will love this lesson! Students will do a number of hands on activities in groups. Students will first solve the problem and then write a formula of how the answer may be found.
University of South Florida
Fcat: Drops on a Penny: Teacher Notes
Young scholars learn how to create stem-and-leaf diagrams and boxplots by collecting data on the surface tension of water molecules. This hands-on activity using pennies is a great way to learn how to organize data.
University of South Florida
Florida Center for Instructional Tech: Walking the Plank
Young scholars use weight to collect data and investigate the linear relationship. This activity uses a graphing calculator.
University of Georgia
University of Georgia: Problem Solving With Heron's Formula
From the University of Georgia, this tutorial provides exercises and problems using Heron's Formula for the area of a triangle, makes use of several problem representation methods, including a graph.
Beacon Learning Center
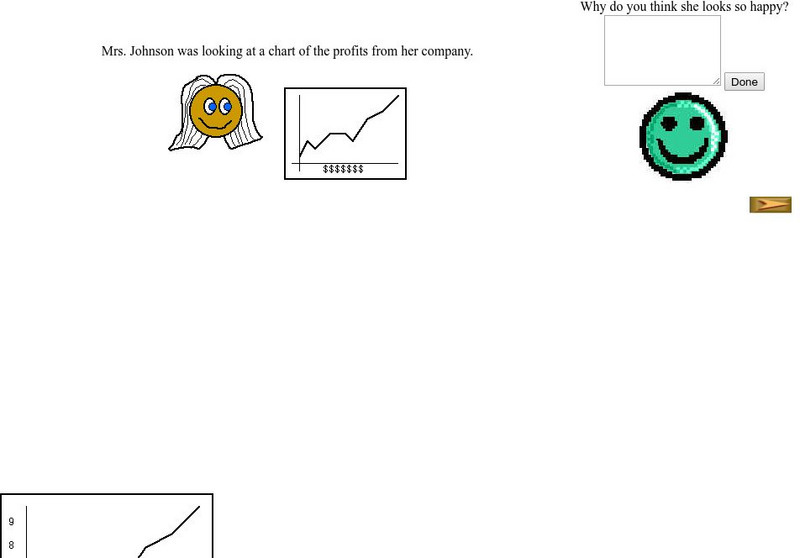
Beacon Learning Center: Interpreting Line Graphs
This site is a lesson on creating and interpreting a line graph. It explains how a line graph is created and then asks questions about what is learned from the data. Students type in open responses, and answers and feedback follow.
Texas Education Agency
Texas Gateway: Predicting, Finding, and Justifying Data From an Equation
Given data in the form of an equation, the student will use the equation to interpret solutions to problems.
Physics Classroom
The Physics Classroom: Kinematic Equations & Problem Solving
This excellent high school physics tutorial from The Physics Classroom investigates motion formulas using several problem-solving strategies including diagrams, equations, and lists.
University of Nottingham
Mathematics Assessment Project: Modeling Population Growth: Having Kittens
This instructional activity unit guides students in developing strategies for modeling problems. The task focuses on investigating a cat shelter's claims about the rate of cat population growth. The unit includes a full lesson plan,...
Illustrative Mathematics
Illustrative Mathematics: Hsa ced.a.2 Create Equations in Two or More Variables
Choose from a variety of creative problems (tasks) to teach how to create equations in two or more variables to represent relationships between quantities and graph equations on coordinate axes with labels and scales. Explanations and...
CPALMS
Cpalms: Dollars for Density
This is a guided inquiry activity in which students use simple lab procedures and discussions to develop and apply the concept of density. Students collect and graph data which they use to explore the relationship between mass and...
Savvas Learning
Prentice Hall Science & Math: Graphing Calculator Help
This site provides very complete help guides for a variety of graphing calculator models, complete with pictures and step-by-step instructions.
Cuemath
Cuemath: Line Graphs
A comprehensive guide for learning all about line graphs with definitions, their sections, how to read and create graphs, solved examples, and practice questions.
Cuemath
Cuemath: Linear Graph
A comprehensive guide for learning all about linear graphs with definitions, properties, their equations, how to plot or analyze them, solved examples, and practice questions.
University of Regina (Canada)
University of Regina: Math Central: Circle and Bar Graphs
Students evaluate data, use the data to make different types of graphs, and then investigate these graphs. Teacher's notes are included along with downloadable versions of the activity. This lesson is from a group of lessons that uses...
University of Regina (Canada)
University of Regina: Math Central: Basics of Graphing
Students learn the basics of graphing including terminology, plotting, and reading points. The lesson has an overview, materials, procedures, and evaluation techniques.
University of Regina (Canada)
University of Regina: Math Central: Linear Graphs
Learners gain the knowledge of how to plot and recognize first degree equations on a graph. The lesson has an overview, materials, procedures, and evaluation techniques.
University of Regina (Canada)
University of Regina: Math Central: Linear Graphs
Learners gain the knowledge of how to plot and recognize first degree equations on a graph. The lesson has an overview, materials, procedures, and evaluation techniques.


