Khan Academy
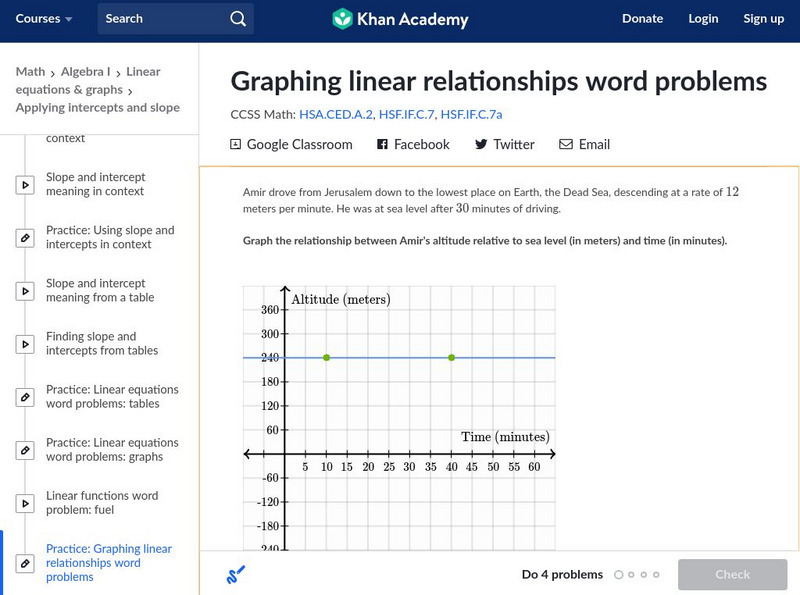
Khan Academy: Graphing Linear Functions Word Problems
Graph the line that represents a real-world relationship that is given verbally. Students receive immediate feedback and have the opportunity to try questions repeatedly, watch a video, or receive hints.
Purple Math
Purplemath: Practical Algebra Lessons
Pre-algebra and algebra lessons, from negative numbers through pre-calculus. Grouped by level of study. Lessons are practical in nature informal in tone, and contain many worked examples and warnings about problem areas and probable...
Purple Math
Purplemath: Practical Algebra Lessons
Pre-Algebra and algebra lessons, from negative numbers through Pre-Calculus. Grouped by level of study. Lessons are practical in nature, informal in tone, and contain many worked examples and warnings about problem areas and probable...
CK-12 Foundation
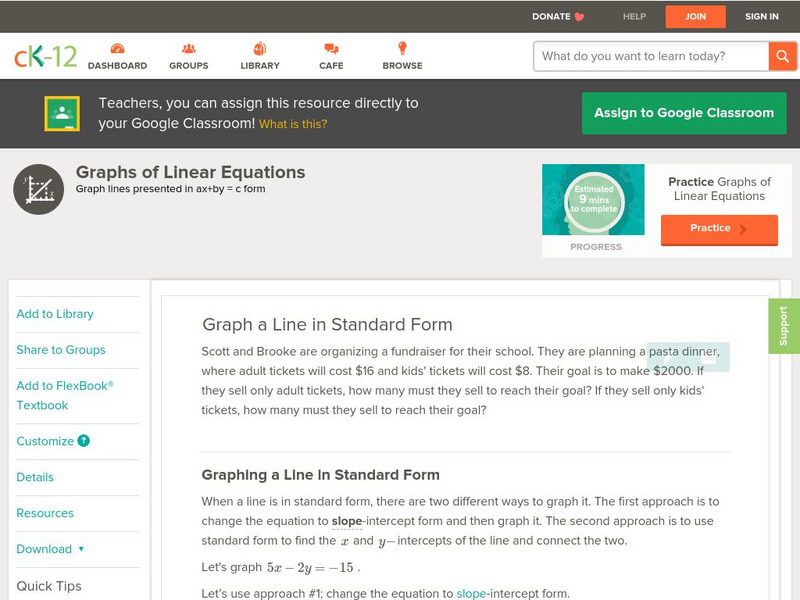
Ck 12: Algebra: Graphs of Linear Equations
[Free Registration/Login may be required to access all resource tools.] Students learn to graph the equation of a line in standard form. Students examine guided notes, review guided practice, watch instructional videos and attempt...
CK-12 Foundation
Ck 12: Algebra: Graphs of Linear Equations
[Free Registration/Login may be required to access all resource tools.] Students learn how to graph linear equations. Students examine guided notes, review guided practice, watch instructional videos and attempt practice problems.
Other
The Coordinate Plane: Graphs & Graphing Calculators
Site provides exercises for graphing on the coordinate plane including distance formula, midpoint formula, graphs of equations, and graphing using a calculator.
Texas A&M University
Wtamu Virtual Math Lab: Beginning Algebra: Graphing Linear Inequalities
A tutorial on how to graph a linear inequality in two variables. The tutorial offers step-by-step instruction and examples of how to graph linear inequalities.
Alabama Learning Exchange
Alex: When Will Mr. "X" Meet Miss "Y"?
During this lesson, students will solve systems of equations graphically. Students will graph various equations individually using graphing paper. They will work with a partner to solve several system of equation problems and then graph...
Cool Math
Coolmath: Systems of Equations Solving by Graphing
Reference material and practice problems solving a system of equations by graphing.
Math Open Reference
Math Open Reference: Graphical Function Explorer (Gfe)
This resource provides a free function grapher. Enter up to 3 equations and plot them. Similar to a graphing calculator.
Khan Academy
Khan Academy: Interpret Equations Graphically
Practice the connection between the graphical representation of equations and their algebraic solutions.
Khan Academy
Khan Academy: Two Variable Inequalities From Their Graphs
Fit an algebraic two-variable inequality to its appropriate graph.
Khan Academy
Khan Academy: Function Rules From Equations
Create functions that match one variable to the other in a two-variable equation. Functions are written using function notation.
Khan Academy
Khan: Lsn 8: Interpreting Relationships in Scatterplots/graphs/tables/equations
This lesson focuses on Interpreting and analyzing linear, quadratic, and exponential models and graphs. Students will use best fit lines to interpret contexts, distinguish whether contexts are linear or exponential functions, use the...
Khan Academy
Khan Academy: Lsn 13: Systems of Equations, Algebraic and Graphical Representations
Lesson 3 of 4 for Passport to Advanced Math. Students will solve systems of equations in two variables in which one equation is linear and the other equation is quadratic or another nonlinear equation; relate properties of the function f...
PBS
Pbs Learning Media: Everyday Algebra Plus: Targeted Math Instruction
Algebra lesson focuses on using patterns and relationships to write equations with two variables to represent relationships and patterns in real-world problems, plotting ordered pairs on a coordinate grid, and interpreting the meaning of...
Wolfram Research
Wolfram Math World: Algebra
MathWorld provides a basic overview of Algebra. Includes a few formulas and many links to related topics.
Richland Community College
Richland Community College: Math 116 Lecture Notes
This site from the Richland Community College provides the detailed lecture notes to a college algebra course, complete with equations and definitions. Content ranges from "functions and their graphs" to "conics and parametric equations."
University of Regina (Canada)
University of Regina: Math Central: Graphing a System of Inequalities
A solution is presented to a student-submitted problem. The problem involves graphing and finding the solution set to a system of inequalities.
Ministry of Education and Universities of the Region of Murcia (Spain)
Ministerio De Educacion Y Ciencia: Ecuaciones Y Sistemas De Ecuaciones
In Spanish. Practice how to solve system of equations graphically with this interactive activity.
Other
College of the Redwoods: Conchoid Nicomedes
This resource derives the equations and gives several examples of Conchoid Nicomedes.
Math Graphs
Houghton Mifflin: Math Graphs: Fitting Models to Scatter Plots 2 [Pdf]
Students use a scatter plot to determine whether data can be modeled by a linear function, a quadratic function, a trigonometric function, or that there appears to be no relationship between x and y. The resource consists of an enlarged...
Math Graphs
Houghton Mifflin: Math Graphs: Parametric Equations 1 [Pdf]
Students explore the graph of a line given by a parametric equation. Topics explored are the orientation and coordinates of the equation. The exercise consists of an enlarged printable version of a graph available in PDF format.
Math Graphs
Houghton Mifflin: Math Graphs: Parametric Equations 2 [Pdf]
Students explore the graph of a line given by a parametric equation. Topics explored are the orientation and coordinates of the equation. The exercise consists of an enlarged printable version of a graph available in PDF format.


