National Research Center for Career and Technical Education
Finance: Depreciation (Double Declining)
Of particular interest to a group of business and finance pupils, this lesson explores depreciation of automobile values by comparing the double declining balance to the straight line method. Mostly this is done through a slide...
Curated OER
Linear and Exponential Functions
This comprehensive unit on linear and exponential functions provides numerous clearly-written worksheets. Topics include graphing linear equations, solving systems of equations algebraically and by graphing, identifying the domain and...
Flipped Math
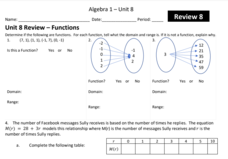
Unit 8 Review: Functions
Let's finish a functional review. Pupils work through 31 items to review the concepts learned in Unit 8. Scholars determine whether a mapping is a function and identify the domain and range. Using function notation, individuals then...
Flipped Math
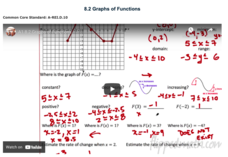
Graphs of Functions
Create a graphical description. Pupils watch a video presentation starting with vocabulary on properties of a graph of a function and then use the vocabulary to find key features of graphs of a function. Scholars use three graphs in the...
Flipped Math
Exponential Decay
The values keep getting smaller—quickly! Pupils watch a video that contrasts exponential decay with exponential growth from the first lesson in the unit. Learners identify exponential functions that are decaying and create graphs of...
Flipped Math
Exponential Growth
They grow by leaps and bounds. Learners watch a quick review on function notation as they prepare to learn more about exponential growth. Using their knowledge from sequences, pupils find out whether a function is linear or exponential,...
Flipped Math
Unit 3 Review: Systems of Equations
More practice makes perfect. A review packet helps pupils remind themselves of the content of the unit. They determine whether points are solutions to linear equations, graph systems of equations and inequalities, and solve systems of...
Rice University
Elementary Algebra
Find all the Algebra 1 content in one location. A helpful eBook contains the content typically found in an Algebra 1 course. Concepts range from solving and graphing linear equations to solving and graphing quadratic equations....
CCSS Math Activities
Smarter Balanced Sample Items: High School Math – Target J
Good graphs make solving systems simpler. Pupils answer 18 questions shown in a PowerPoint presentation as part of the Claim 1 Item Slide Show series. By considering these questions, they review the concepts of graphing equations and...
Mathematics Vision Project
Module 2: Linear and Exponential Functions
Write, graph, and model all things linear and exponential. Building on the previous module in a nine-part Algebra I series, learners compare linear exponential modeling. They write equations, graph functions, and analyze key features.
Physics Classroom
Using Graphs
Many university professors complain incoming scholars struggle with interpreting graphs. A skill builder offers three different types of exercises including calculating slope, interpreting graphs, and extrapolating outside the plotted...
Kenan Fellows
Density
Most scholars associate density with floating, but how do scientists determine the exact density of an unknown liquid? The third lesson in a seven-part series challenges scholars to find the mass and volume of two unknown liquids. Each...
Yummy Math
A Cardioid for Valentine’s Day
It's Valentine's Day in geometry class! Celebrate the day of love with a heart-themed activity in which young mathematicians create a cardioid on polar graph paper.
Shodor Education Foundation
Conic Flyer
Graphing conics made easy. Individuals use an interactive to graph conic sections. The app can handle circles, vertical and horizontal parabolas, ellipses, and vertical and horizontal hyperbolas.
Shodor Education Foundation
Multi-Function Data Flyer
Explore different types of functions using an interactive lesson. Learners enter functions and view the accompanying graphs. They can choose to show key features or adjust the scale of the graph.
Shodor Education Foundation
Linear Inequalities
An interactive lesson helps individuals learn to graph inequalities in two variables. Scholars can adjust the interactive to present the inequalities in standard or slope-intercept form.
GeoGebra
Too Big, or Not Too Big
Determine whether the point is just right. The interactive allows participants to input a constraint equation. Pupils pick a point and determine whether it is too big, not too big, or just right for the constraint. Using the graphing...
CK-12 Foundation
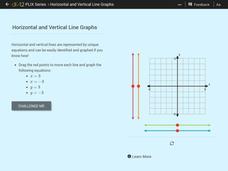
Horizontal and Vertical Line Graphs
See how vertical and horizontal lines have special equations. Scholars drag vertical and horizontal lines onto a coordinate plane to graph given equations. They then answer a set of challenge questions on the topic.
CK-12 Foundation
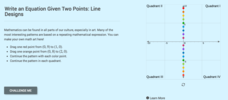
Graphs of Linear Functions: Line Designs
Designs from lines are sublime. Scholars create colorful designs by connecting points on an interactive coordinate plane. They answer questions about slope and quadrants based on their designs.
Teach Engineering
All About Linear Programming
Class members connect engineering with an understanding of linear programming using a technical resource. Scholars learn about linear programming (linear optimization) and how it applies to engineering design in the first of two modules....
Noyce Foundation
Perfect Pair
What makes number pairs perfect? The resource provides five problems regarding perfect pairs of numbers, the definition of which changes in complexity with each task. Solutions require pupils to apply number sense and operations, as well...
Balanced Assessment
Time Line
Use a graph to tell a story! Given a graph, young scientists create a story to match. They must provide their own axes labels and description of the scenario. The graph has increasing, decreasing, and constant sections.
Inside Mathematics
Graphs (2006)
When told to describe a line, do your pupils list its color, length, and which side is high or low? Use a activity that engages scholars to properly label line graphs. It then requests two applied reasoning answers.
Teach Engineering
The Temperature Effect
How temperature affects the efficiency of a solar panel is the focus of the third in a series of eight resources that presents how engineers are able to control the temperatures of photovoltaic panels. Class members find out how the...


