EngageNY
Polynomial, Rational, and Radical Relationships
This assessment pair goes way beyond simple graphing, factoring and solving polynomial equations, really forcing learners to investigate the math ideas behind the calculations. Short and to-the-point questions build on one another,...
Curated OER
Taxi!
Your young taxi drivers evaluate and articulate the reasoning behind statements in a conceptual task involving linear data. The given data table of distances traveled and the resulting fare in dollars is used by learners to explore...
National Research Center for Career and Technical Education
Business Management and Administration: Compound Interest - A Millionaire's Best Friend
Many math concepts are covered through this resource: percentages, decimals, ratios, exponential functions, graphing, rounding, order of operations, estimation, and solving equations. Colorful worksheets and a link to a Google search for...
Curated OER
Connecting Algebra and Geometry Through Coordinates
This unit on connecting algebra and geometry covers a number of topics including worksheets on the distance formula, finding the perimeter and area of polynomials, the slope formula, parallel and perpendicular lines, parallelograms,...
Curated OER
Quick Graphs of Linear Equations
Graph equations of lines using the slope-intercept method or by plotting both x and y intercepts. Determine if two lines are parallel or perpendicular by comparing their slopes. This handout includes step-by-step directions and four...
Curated OER
Systems of Equations and Inequalities
This is a comprehensive lesson on creating and solving equations and systems of equations and inequalities. Problems range from basic linear equations to more complex systems of equations and inequalities based on a real-world examples....
Texas Instruments
Graphs of Rational Functions
Take your kids on a tour of graphing rational functions. Using this TI lesson, high schoolers identify the end behavior of their functions. They find the domain and range, describe end behavior, and look at asymptotes and restrictions of...
Curated OER
Graphing Exponentials
Bring your Algebra class to the computer lab! Using materials created by Texas Instruments, they explore exponentiasl and graphs. Be sure to download the correct materials (on the right side of the webpage) before having them walk...
Virginia Department of Education
Transformationally Speaking
Young mathematicians explore transformations of graphs by graphing sets of functions on the same pair of axes. They use their graphs to determine the effect that the values of a and b in y = ax + b have on the graph of y = x.
Curated OER
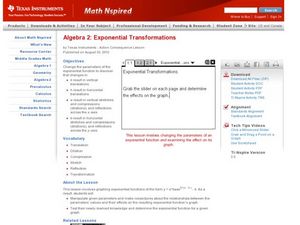
Exponential Transformations
Perform transformations on exponential functions! Teach your class how to perform dilation, compression, and translation. They graph exponential functions using the TI Calculator.
Curated OER
Power Function Inverses
Pupils graph polynomial functions and analyze the graphs. They identify the inverse of the functions and find the domain and range. Learners will then label the functions as one to one and use the horizontal and vertical line test to...
Curated OER
Solving Logarithmic Equations
High schoolers solve logarithmic equations. They graph and plot logarithmic functions and use algebraic steps and the calculator to simplify and solve the equations.
Curated OER
Application of Function Composition
Young mathematicians solve composition of functions. They add, subtract, multiply and divide functions and then identify the domain and range of each function. An embedded animation shows three different applications of function...
Curated OER
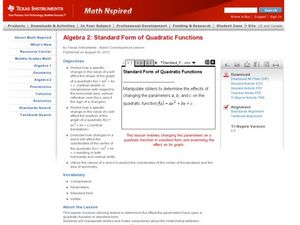
Standard Form of Quadratic Functions
Students factor quadratic equations. In this algebra lesson, students identify the factors and use them to graph the parabola. They find the parameters and vertex of each graph.
Curated OER
Investigating Correlation
High schoolers investigate different types of correlation in this statistics lesson. They identify positive, negative and no correlation as it relates to their data. They then find the line of best fit for the plotted data.
Curated OER
Finite Differences
Young mathematicians solve problems with polynomials. As they graph and analyze polynomial functions, learners define constant and finite, and determine the relationship between the constant set of differences and the slope of a linear...
Curated OER
Exponential vs. Power
Pupils differentiate between exponential and power functions. They identify the base, exponent and properties of exponential functions. They also graph the functions using the TI calculator.
Curated OER
Graphic Designing with Transformed Functions
Teach your class how to transform a graph! By identifying the domain and range of the functions, learners can observe the parabola and find the vertex of the transformed graph.
Curated OER
Discriminant Testing
The class works to identify solutions using the discriminant.They use part of the quadratic formula to find the number of solutions a quadratic equation will have. They calculate how-many times the quadratic function will cut the x-axis....
Curated OER
Exploring Power Functions 1
Learners describe the end behavior of polynomial functions. Pupils relate the behavior of the graph to the exponent of the graph. They differentiate graphs with odd-exponent and graphs with even exponents.
Curated OER
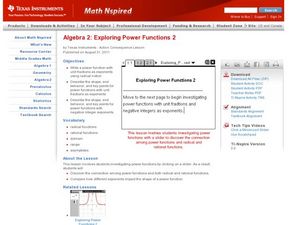
Exploring Power Functions 2
Young mathematicians learn to write algebraic equations. They solve and graph different polynomial functions with different powers. They then graph radicals and identify the domain and range.
Curated OER
Logarithmic Transformations
Using the TI calculator to visualize and make predictions, high schoolers perform transformation vertically and horizontally on logarithmic graphs in order to solve problems.
Curated OER
Solving Exponential Equations
Solving exponential and logarithmic equations is taught in this interactive lesson. Students use properties of logarithm and exponents solve functions. They estimate the solution and use the Ti to find the exact solution.
Curated OER
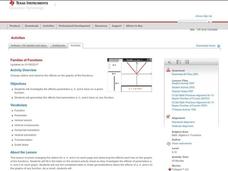
Families of Functions
Learners use sliders to change the parameters of functions and examine how shifting parameters affects a graph. They identify the parameters of functions, find vertical and horizontal stretches, then calculate the scale factor and other...


