Curated OER
Logarithmic Transformations
Using the TI calculator to visualize and make predictions, high schoolers perform transformation vertically and horizontally on logarithmic graphs in order to solve problems.
Curated OER
Solving Exponential Equations
Solving exponential and logarithmic equations is taught in this interactive lesson. Students use properties of logarithm and exponents solve functions. They estimate the solution and use the Ti to find the exact solution.
Curated OER
Multiple Representations
Every topic or subject has its own special jargon. Learners work on their math vocabulary as it relates to basic algebra terms. They define and identify function, functional notation, ordered pairs, rate of change, slope,...
Curated OER
Families of Functions
Learners use sliders to change the parameters of functions and examine how shifting parameters affects a graph. They identify the parameters of functions, find vertical and horizontal stretches, then calculate the scale factor and other...
Curated OER
Parabolic Paths
Learners investigate properties of parabolas. In this algebra lesson plan, students identify the different paths of a parabola. They use the navigator to make observations of the parabola.
Curated OER
Extraneous Solutions
High schoolers find the roots of quadratic equations. In this algebra lesson, students solve radical equations and identify the positive and negative roots. They graph and analyze their functions.
Curated OER
Polynomials: Factors, Roots and Zeroes
Students factor polynomial equations. In this algebra lesson, students identify the zeros of the equations. They use algebra to rewrite word problems using symbols.
Curated OER
Watch Your P' and Q's
Pupils solve polynomial functions by graphing. They factor rational expressions to find the roots of the equation and apply the rational zero theorem to find the zeros of a polynomial.
Curated OER
Graph Logarithms
Mathematicians graph logarithmic equations. Teach your students how to identify the intercepts of logarithmic equations and tell whether the function is increasing or decreasing. They find the domain and range of each function.
Curated OER
How Many Solutions to the System?
Solve systems of equation using graphing! In this algebra activity, learners use the TI to graph two lines and identify the number of solutions. They perform interactive graphing on the navigator.
Curated OER
Zeros of a Quadratic Function
Factor quadratic equations by teaching your young scholars how to identify the zeros of the quadratic function. They use the TI to see where the graph will intercept the coordinate plane.
Curated OER
Seeing is Believing: Derivatives
Learn to solve functions by taking the derivatives. In this calculus lesson, students compare the graph of a derivative to that of the original function.
Curated OER
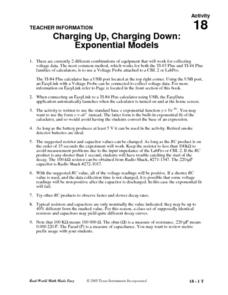
Charging Up, Charging Down
Learners collect and analyze voltage data. Then, they investigate exponential functions using the TI and a Voltage Probe and graph their data and analyze it using a table.
Curated OER
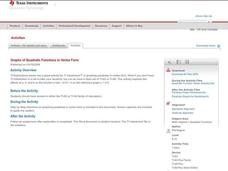
Graphing Quadratic Functions
Pupils explore quadratic functions in this algebra lesson plan. They investigate transformation of quadratic functions using the TI calculator. They use the vertex form for this lesson plan.
Curated OER
Standard Form of Equations
Learners complete the square and identify different parts of a quadratic equation. In this algebra lesson, pupils graph conics using the TI calculator. They rewrite equations by completing the square.
Curated OER
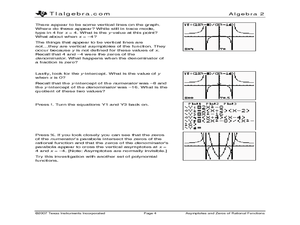
Asymptotes and Zeros
Learn how to explore rational functions and investigate the graphs rational functions and identify its singularities and asymptotes. High schoolers approximate the solutions to rational equations and inequalities by graphing.
Curated OER
Flipping Coins: Density as a Characteristic Property
Young scholars explore linear functions in a crime solving context. They collect and analyze data using linear equations, then interpret the slope and intercepts from a linear model.
Curated OER
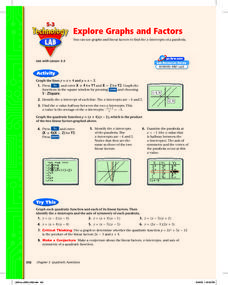
Explore Graphs and Factors
Pupils graph the factors of a quadratic as linear equations and graph the parabolic equation in factored form. Also, they investigate the relationship between the x-intercepts of the lines and the zeros of the parabola.
Curated OER
TI-Nspire Activity: What Does Your Representation Tell You?
By learning to select the best representation for three meal plans, students compare three meal plans to determine the best choice. Data for the meal plans is sorted on a table, as an algebraic equation, and graphed on a coordinate grid....
Curated OER
Show Me the Money
Pupils investigate financial applications of mathematics in this mathematics lesson. They will investigate equations that represent a company’s income, expense, and profit functions and use those equations to identify break even points...
Curated OER
Graphing Systems at the Races
Learners investigate systems of equations as they use the Ti-Navigator to explore scenarios about dog races and NASCAR races. Pupils determine the winner of the race and when opponents pass each other given a speed and distance.
Curated OER
Screaming for Ice Cream
Mathematicians investigate maximizing volume by learning to explore the problem in which they seek to maximize the volume of a cone. Learners solve the problem symbolically, graphically, and through the use of integration or...
Curated OER
Paying College Tuition
The investigation of exponential equation in the context of increasing college tuition costs is explored through this lessib. Young scholars write exponential equations based on the percent of change of college tuition and use their...
Curated OER
Hit and Run
Pupils explore data collection in this lesson. They investigate distance vs. time and velocity vs. time graphs using information collected with a CBR 2 to simulate the reconstruction of an accident.


