Curated OER
Multiple Representations
Every topic or subject has its own special jargon. Learners work on their math vocabulary as it relates to basic algebra terms. They define and identify function, functional notation, ordered pairs, rate of change, slope,...
Curated OER
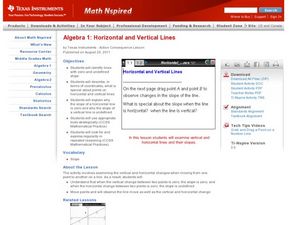
Horizontal and Vertical Lines
High schoolers solve equations and graph-their solutions. In this algebra lesson, students, identify the type of line using the slope of the equation. They graph and observe their lines.
Curated OER
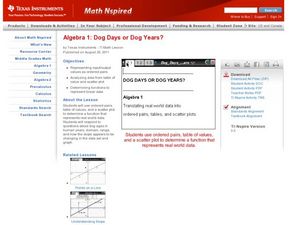
Dog Days or Dog Years?
In need of some algebraic fun with real world implications?Learners use ordered pairs, a table of values and a scatter plot to evaluate the validity of several real world data sets. The class focuses on dog ages in human years, domain,...
Curated OER
Paying College Tuition
The investigation of exponential equation in the context of increasing college tuition costs is explored through this lessib. Young scholars write exponential equations based on the percent of change of college tuition and use their...
Curated OER
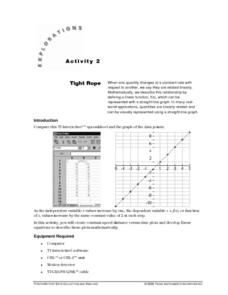
Tight Rope
Learn how to explore the concept of linear functions. In this linear functions lesson, students collect linear data from a motion detector. Students walk to create a linear function. Students plot the points on a graph and determine a...
Curated OER
Investigating Equations of Lines
High schoolers investigate linear equations as they use technology (Cabri, Jr.) to explore the equations of lines in slope-intercept form. The technology allows learners to manipulate the line and observe the changes in the parameters of...
Alabama Learning Exchange
Investigating School Safety and Slope
Learners investigate the slope of various stairways through a "news report" approach and employ mathematical knowledge of applied slope to report on wheelchair accessibility and adherence to Americans with Disabilities Act. They...
Curated OER
Geometric Sequences and Series
Learners find common ratios of geometric sequences on a spreadsheet. Using this data, they create scatter plots of the sequences to determine how each curve is related to the value of the common ratio. They will consider whether series...
Curated OER
Math TODAY for TI-Navigator System - Humidity Makes Air Feel Even Hotter ? Part II
Learners explore quadratic and cubic functions that will model the relationship between air temperature and heat index at fixed relative humidity values. They also make generalizations and apply the findings using their TI-83 Plus or...
Curated OER
Math TODAY Challenge - New Color of Money
High schoolers read about the changes in the "new money" and then create a graph to represent various combinations of currency produced.
Curated OER
Trains in Motion
Students compare two object as they find the distance between them. In this geometry lesson, students create an equation describing the distance of time as a function. They use the navigator to observe the distance.
Curated OER
Match Me Plus
Have your class investigate Piecewise functions by matching a position versus time graph to the function that describe the walk.
Curated OER
Count the Differences
Pupils find the difference between consecutive y-values on the calculator and write an equation that fits the data. They continue finding the differences in consecutive y-values using lists on their calculator. Learners conclude as they...
Curated OER
Count the Differences
Pupils determine the degree of polynomials. In this determining the degree of polynomials lesson, students find the difference between consecutive y-values. Pupils find the degree of a linear, quadratic, and cubic function by this...
Math Medics
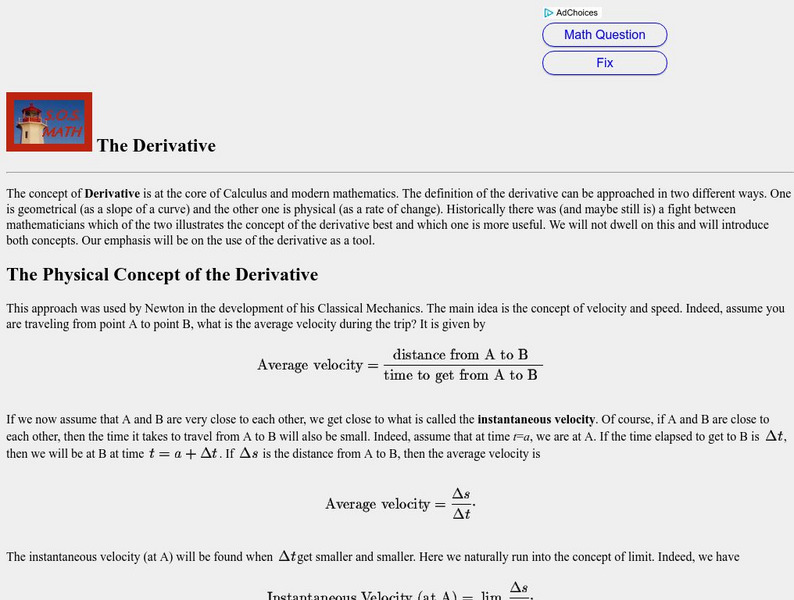
S.o.s. Math: The Derivative
This lesson does a nice job of clarifying what it means to find a derivative. The lesson gives an algebraic method for finding the derivative using limits and offers a geometric interpretation of the derivative.
Varsity Tutors
Varsity Tutors: Hotmath: Practice Problems: Relations and Functions
Hotmath provides 25 practice problems dealing with relations, functions, and their graphs. Each of the practice problems include a step-by-step guide for solving their Algebraic problem.
University of Colorado
University of Colorado: Ph Et Interactive Simulations: Calculus Grapher
Draw a graph of any function and see graphs of its derivative and integral. Don't forget to use the magnify/demagnify controls on the y-axis to adjust the scale.
Paul Dawkins
Paul's Online Notes: Average Function Value
This tutorial takes a look at using definite integrals to determine the average value of a function on an interval and also the Mean Value Theorem for integrals.
CK-12 Foundation
Ck 12: Interactive Algebra 1 for Ccss
This is a complete, full-year Algebra 1 course with interactivity included in every lesson. Some lessons include videos, and all include interactives and inline questions that offer instant, per-answer feedback. Every lesson also has...
Dartmouth College
Dartmouth College: Mqed: Rates of Change
The resource investigates rates of change using the program STELLA. Discussion questions and exercises are included in the monograph.
University of Illinois
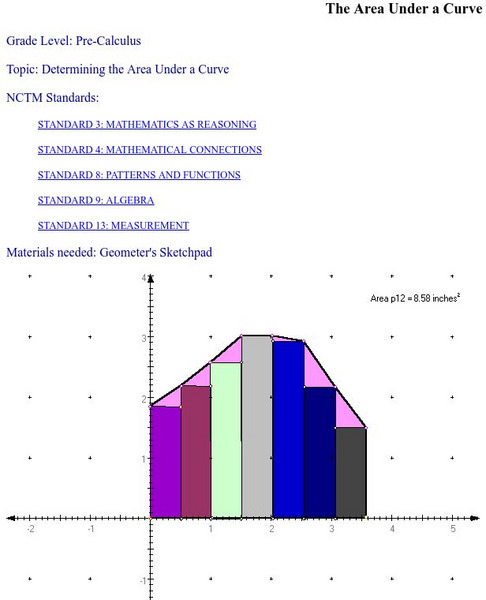
University of Illinois: The Area Under a Curve
This site explains how to find the area under of a curve.
Texas Instruments
Texas Instruments: Math Today Population on the Move
In this activity students will determine the rate of change (slope) & build a linear model (y = mx + b) from this data. The model will be used to make a prediction about the future growth of the population of the U.S. if the current...
Texas Instruments
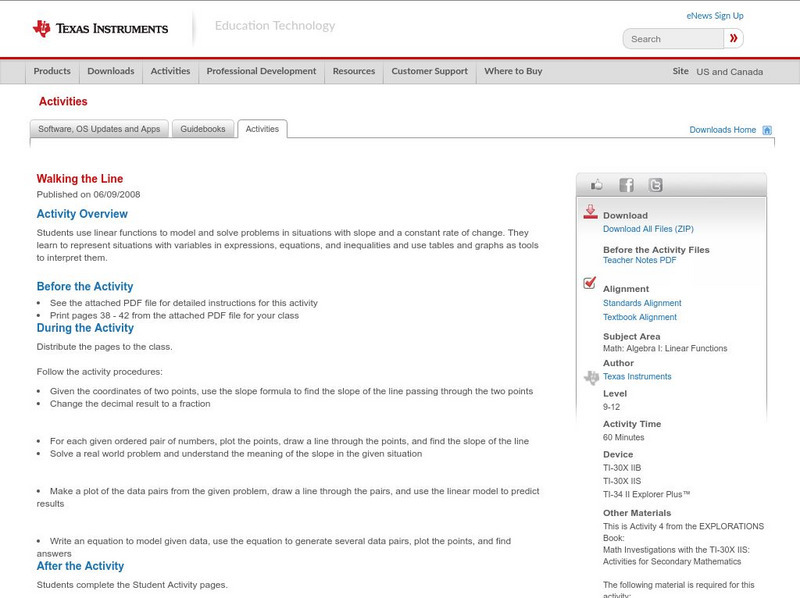
Texas Instruments: Walking the Line
In this activity, students use linear functions to model and solve problems in situations with slope and a constant rate of change. They learn to represent situations with variables in expressions, equations, and inequalities and use...
Texas Instruments
Texas Instruments: How Fast for Whiplash? Going With the Flow
In this activity, students recognize direct variation as a rate of change and apply it in problem situations. They also use average rates of change to make decisions in problem situations.


