Curated OER
Horizontal and Vertical Lines
Students solve equations and graph-their solutions. In this algebra lesson, students, identify the type of line using the slope of the equation. They graph and observe their lines.
Curated OER
Transformations of Functions 1
Learn how to solve problems with transformation. High schoolers perform transformation on their graphs. Then, they use the TI to create a visual of the graph as it is moving along the graph.
Curated OER
Transformations of Functions 2
Solving problems on the TI graphing calculator can be quite easy. Students observe the properties of transformation of functions and create a formula for the transformation.
Curated OER
Zeros of a Quadratic Function
Factor quadratic equations by teaching your learners how to identify the zeros of the quadratic function. They use the TI to see where the graph will intercept the coordinate plane.
Curated OER
Domain and Range of Exponential Functions
Have your class find the domain and range for each function. High schoolers graph equations using the TI. They find all the x and y values as they relate to the domain and range.
Curated OER
Exponential Functions f(x) = abx
Students define exponential functions and graph the equation. In this algebra lesson, students discuss exponential growth and decay as they graph their functions. They differentiate between the base of growth and decay.
Curated OER
Comparing Linear and Exponential Data
Students graph linear and exponential equations. In this algebra lesson, students differentiate between linear and exponential equations. They relate it to the real world.
Curated OER
Dog Days or Dog Years?
In need of some algebraic fun with real world implications?Learners use ordered pairs, a table of values and a scatter plot to evaluate the validity of several real world data sets. The class focuses on dog ages in human...
Curated OER
Charging Up, Charging Down
Learners collect and analyze voltage data. Then, they investigate exponential functions using the TI and a Voltage Probe and graph their data and analyze it using a table.
Curated OER
Graphing Quadratic Functions
Pupils explore quadratic functions in this algebra activity. They investigate transformation of quadratic functions using the TI calculator. They use the vertex form for this activity.
Curated OER
Quartic Inflection
Learners use their TI-89 calculator to find properties of the quartic polynomials. The instructional activity includes detailed instructions along with screen shots of the graphing calculator display.
Curated OER
Exploring the Exponential Function
Learners collect and analyze data regarding exponential functions of the form y = abx. Young scholars explore the affects of changing parameters on the graph of the function.
Curated OER
Connecting Factors and Zeros
In this Algebra II lesson plan, students explore the connection between the factored form of a quadratics and the zero of a function. Students use a graphing calculator to verify factoring numerically and graphically.
Curated OER
Home Sales Records
Teach your class how to calculate monthly payments on a home mortgage. For this percent lesson, high schoolers calculate the monthly payment on a home mortgage, and compare different lengths of time and the interest rates for national...
Curated OER
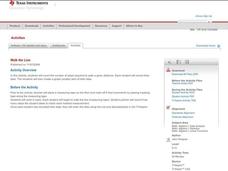
Walk the Line
Learners create constant speed versus motion graphs. They will perform linear regressions on their data to describe the graphs mathematically.
Curated OER
Wrapping It All Up
Through learning how to examine linear, quadratic, and exponential functions, high schoolers explore the effects of changes in parameters on the graphs of linear, quadratic, and exponential functions. The lesson is designed to be a...
Curated OER
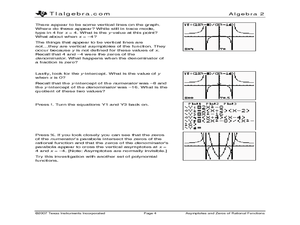
Asymptotes and Zeros
Learn how to explore rational functions and investigate the graphs rational functions and identify its singularities and asymptotes. Students approximate the solutions to rational equations and inequalities by graphing.
Curated OER
Flipping Coins: Density as a Characteristic Property
Young scholars explore linear functions in a crime solving context. They collect and analyze data using linear equations, then interpret the slope and intercepts from a linear model.
Curated OER
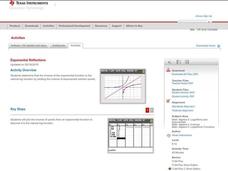
Exponential Reflections
Explore the natural log function through the investigation of inverse of the exponential functions by plotting the inverse of the exponential solution points. Students examine the results to determine that the inverse is the...
Curated OER
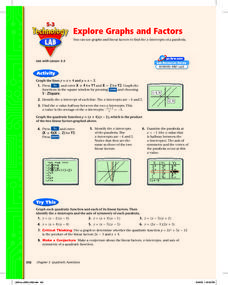
Explore Graphs and Factors
Pupils graph the factors of a quadratic as linear equations and graph the parabolic equation in factored form. Also, they investigate the relationship between the x-intercepts of the lines and the zeros of the parabola.
Curated OER
Name That Tune: Matching Musical Tones Through Waveform Analysis
Pupils detect the waveform of musical notes to determine the code for the "safe" in this forensics simulation lesson. They use a microphone and tuning forks along with Vernier EasyData on their graphing calculator to analyze five musical...
Curated OER
TI-Nspire Activity: What Does Your Representation Tell You?
By learning to select the best representation for three meal plans, students compare three meal plans to determine the best choice. Data for the meal plans is sorted on a table, as an algebraic equation, and graphed on a coordinate grid....
Curated OER
Show Me the Money
Pupils investigate financial applications of mathematics in this mathematics activity. They will investigate equations that represent a company’s income, expense, and profit functions and use those equations to identify break even points...
Texas Instruments
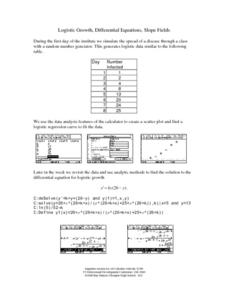
Logistic Growth, Differential Equations, Slope Fields
Investigate differential equations with your class. They use the TI-89 to explore differential equations analytically, graphically, and numerically as the examine the relationships between each of the three approaches.


