CK-12 Foundation
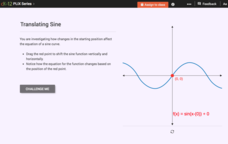
Translating Sine and Cosine Functions: Translating Sine
Learn how to slide sine back and forth and up and down. Pupils move the starting point of a graph of sine vertically and horizontally. They investigate the changes to the equation of the graph in relationship to the translation. They...
CK-12 Foundation
Quadratic Functions and Their Graphs: Soccer Ball Trajectory
Determine critical points in the flight of a soccer ball. Pupils use an interactive resource to find the vertex and x-intercepts of the graph of the trajectory of a soccer ball after being kicked. Scholars investigate the trajectory...
CK-12 Foundation
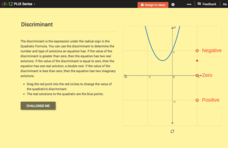
Discriminant
Discriminate between the types of roots. The interactive root introduces the discriminant and its connection to the types and number of roots. Pupils use a slider to view graphically the effect of the sign of the discriminant on a...
CK-12 Foundation
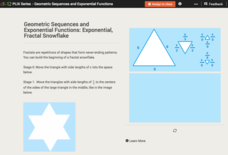
Exponential Growth: Exponential, Fractal Snowflakes
Examine an exponential growth model. Using a fractal, learners calculate the perimeters of each stage. When comparing the consecutive perimeters, a pattern emerges. They use the pattern to build an equation and make conclusions.
CK-12 Foundation
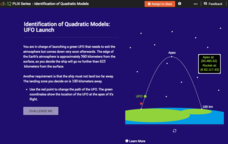
Identification of Quadratic Models: UFO Launch
Build conceptual understanding of graphs of quadratic functions with an out-of-this-world resource. An interactive lesson allows learners to manipulate a graph that models the launch of a UFO. The lesson focuses on the key features of...
CK-12 Foundation
Graphs of Quadratic Functions in Intercept Form: Architectural Bridge Challenge
There are architectural parabolas all around us! A creative lesson analyzes the architecture of a parabolic bridge. Learners must manipulate the bridge to satisfy given criteria and then answer questions about the dimensions of the...
CK-12 Foundation
Quadratic Functions and Equations
The form of a quadratic function paints a picture of its graph. Young mathematicians explore this connection by locating key features on a graph and then writing the corresponding equations. The interactive tutorial highlights key...
CK-12 Foundation
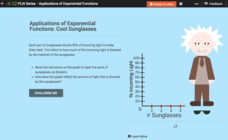
Exponential Decay: Cool Sunglasses
Who wouldn't want to wear four pairs of sunglasses? Each pair of sunglasses reduces the percent of incoming light by one-half. An interactive tutorial helps young mathematicians build a graph that models this scenario. They...
CK-12 Foundation
Logarithms: Logarithm Triangle
Study logarithmic properties using a triangle. A clever manipulative shows how a triangle can represent the three parts of a logarithmic or exponential equation. Pupils review the concept and then answer guiding questions to further...
Teach Engineering
Biomimicry and Sustainable Design - Nature is an Engineering Marvel
Discover how copying nature can be beneficial to humans. Scholars read articles about examples of biomimicry and its potential applications. Along the way, they learn about Nature's Nine Laws and how they relate to biomimicry. This is...
PBL Pathways
Medical Insurance 3
Create a technical report explaining the components of a medical plan through a function. The project-based learning activity gives a medical insurance scenario that young mathematicians model using piecewise functions. Their analyses...
PBL Pathways
Medical Insurance 2
Make an informed decision when choosing a medical insurance provider. An engaging lesson asks your classes to write piecewise models to represent the cost of different medical plans. The project-based learning activity is a variation of...
PBL Pathways
Medical Insurance
Design a plan for finding the best health insurance for your money. Learners compare two health plans by writing and graphing piecewise functions representing the plan rules. Using Excel software, they create a technical report...
PBL Pathways
Students and Teachers 2
Examine trends in student-to-teacher ratios over time. Building from the first task in the two-part series, classes now explore the pattern of student-to-teacher ratios using a non-linear function. After trying to connect the pattern to...
PBL Pathways
Death Project
Verify the rule of thumb for finding the time of death. The project-based learning task asks pupils to determine when the rule of thumb process of finding the time of death is appropriate. Learners develop a function for the rule and...
Virginia Department of Education
Quadratic Modeling
Use a one-stop resource for everything you'd possibly want to teach about quadratic functions and models. Scholars analyze key features of quadratic functions as well as transformations of functions through seven activities....
Virginia Department of Education
Graphing Linear Equations
Combine linear equations and a little creativity to produce a work of art. Math scholars create a design as they graph a list of linear equations. Their project results in a stained glass window pattern that they color.
Intel
Choreographing Math
Leaners investigate families of linear functions through dance. They choreograph dance moves to model nine unique linear functions of their choosing. Using their dance moves, teams create a video presentation complete with music and...
02 x 02 Worksheets
Absolute Value Equations and Inequalities
Demonstrate the meaning of an absolute inequality using three different methods. Here, scholars explore absolute value inequalities through graphing, number line distance, and compound inequalities. Pupils complete various activities to...
Balanced Assessment
Garages and Phones
Examine and compare a linear and step function. The task provides two scenarios, one modeled by a linear function and the other a step function. Pupils create a graph for each and explain how each compares to the other.
Balanced Assessment
Vacation in Bramilia
This performance task gives the population model of different types of flies and asks scholars to analyze the two populations. After interpreting the functions individually, participants compare the two populations and find the time...
Balanced Assessment
Postcards from the Falls
Pupils use graphs to analyze two pricing schemes for postcards. After determining which is the best deal, individuals determine what is wrong with the other pricing structures and explain their thinking.
Illustrative Mathematics
Modeling London's Population
Looking at London's population from 1801–1961 in 20 year increments, high school mathematicians determine if the data can be modeled by a given logistic growth equation. They explain their thinking and determine the values of each...
Balanced Assessment
Books from Andonov
To examine mathematical functions in a modeling situation pupils combine quadratic and step functions to represent a presented scenario. They both graph and write a function to represent data shown in a table.


