Texas Instruments
Quartic Regions
Young scholars explore quartic functions in this calculus lesson. They investigate an application of derivatives and definite integrals, then explore the question of which of the "three bumps" of a quartic is the largest.
Curated OER
The Quest for Roots of Higher Order Equations
Young mathematicians explore the concept of solutions to higher order equations as they find roots of polynomials of degree three or higher. They also use the zero function on the Ti-83 to locate zeros of polynomials on a graph.
Curated OER
Volumes of Rectangular Prisms
Students determine the volume of a rectangular prism. They then maximize and minimize the volume given variable side lengths. Finally, they factor the volume equation to determine the side lengths.
Curated OER
Zeros of Polynomials
Students graph polynomials. For this Algebra II lesson, students investigate the graph of a polynomial to determine the value and the number of zeros. This lesson requires the use of a graphing calculator.
Alabama Learning Exchange
Technology for Displaying Trigonometric Graph Behavior: Sine and Cosine
Young scholars explore the concept of sine and cosine. In this sine and cosine lesson, students work in groups to graph sine and cosine functions. Young scholars examine how coefficients in various parts of each parent function shift...
Curated OER
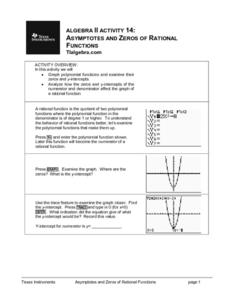
Asymptotes And Zeros of Rational Functions
Budding mathematicians graph polynomial functions and examine their zero and y-intercepts. They analyze how the zero and y-intercepts of the numerator and denominator affect the graph of a rational function. Several great additional...
Curated OER
Count the Differences
Pupils find the difference between consecutive y-values on the calculator and write an equation that fits the data. They continue finding the differences in consecutive y-values using lists on their calculator. Learners conclude as they...
Curated OER
Count the Differences
Learners determine the degree of polynomials. In this determining the degree of polynomials lesson, students find the difference between consecutive y-values. Learners find the degree of a linear, quadratic, and cubic function by this...
Wolfram Research
Wolfram Math World: Rational Function
This site provides formulas and definitions as well as related links to rational functions.
Cuemath
Cuemath: Rational Function
A comprehensive guide for learning all about rational functions with definitions, how to plot them, solved examples, and practice questions.
Curated OER
Zona Land: Definition of a Rational Function
A thorough introduction to rational functions, covering domain, range, graphs, intercepts, and end behavior.
Curated OER
Zona Land
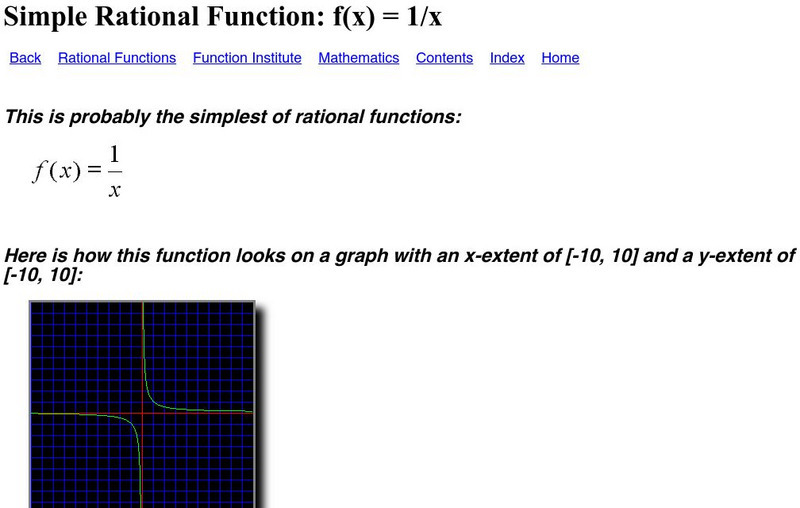
Site explains asymptotes well using reciprocal function as example. Points out weaknesses that technology has when graphs are close to asymptotes.
Mathematics Archives
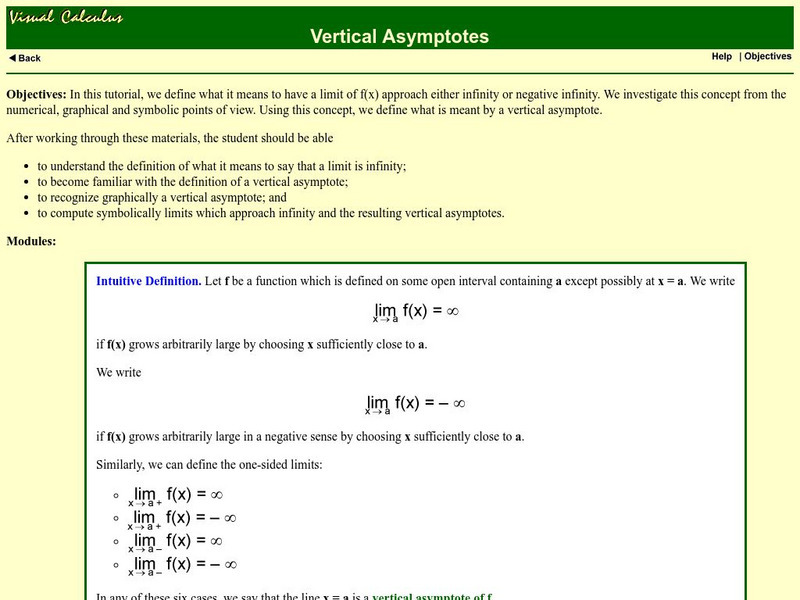
Math Archives: Visual Calculus: Verical Asymptotes
This site discusses how to find vertical asymptotes and their graphs.
Windstream
Ojk's Precalculus Study Page: Quadratic Functions: Graphs
A tutorial devoted to the steps used to graph a quadratic function. Includes tables, graphs, and several sample problems.
Oregon State University
Oregon State University: Rational Functions
A look at graphs of rational expressions, finding properties of the graph by using calculus. Formulas included.
Richland Community College
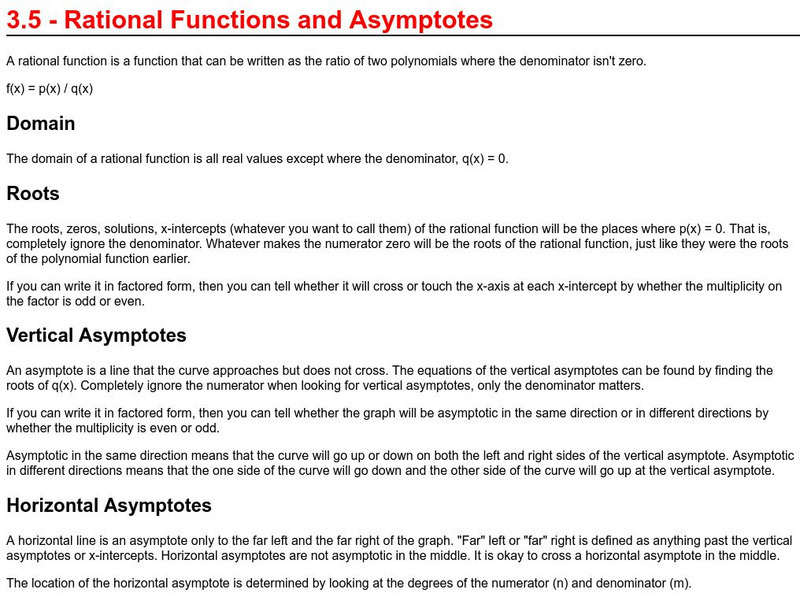
Richland Community College: Rational Functions and Asymptotes
This site contains basic information on rational functions. Gives definition, how to find domain and roots, and how rational functions apply to asymptotes and holes in the graph.
Texas Instruments
Texas Instruments: Rational Functions
In this set of questions, students are asked to investigate rational functions to find vertical, horizontal, and oblique asymptotes as well as x- and y-intercepts. Questions are multiple choice and true/false with solutions provided.
Texas Instruments
Texas Instruments: Rational Functions Asymptotes and Holes
These multiple-choice and fill-in-the-blank questions ask students to identify asymptotes, holes, and domain for rational functions.
Texas Instruments
Texas Instruments: Graphing the Rational Function F(x)=1/x
This is designed for Algebra 2 students to help them develop an understanding of transformations, asymptotes, domain and range.
Texas Instruments
Texas Instruments: Graphing Rational Functions
The activity summarizes vertical asypmtotes, horizontal asymptotes, slant asymptotes, x-intercepts, y-intercept of rational functions.
Texas A&M University
Wtamu Virtual Math Lab: College Algebra: Graphing Functions by Plotting Points
Learn how to graph a function by plotting points and how to determine the domain and range of a function through sample problems and step-by-step solutions and practice problems for you to complete.
Texas A&M University
Wtamu Virtual Math Lab: College Algebra: Graphs of Rational Functions
Use this tutorial to learn how to graph rational functions. Sample problems will guide you through finding the domain and asymptotes, and graphing the function on a coordinate plane.
Analyze Math
Analyze Math: Identify Graphs of Functions
Learners examine graphs of algebraic functions. Four graphs are given and students identify the corresponding algebraic function. The activity includes examples with detailed solutions.
Texas Instruments
Texas Instruments: Graphing Polynomial Functions
Here's a very detailed, step-by-step activity for students to do to learn about the relationship between the factored form of a polynomial function and its graph. Calculator instructions for the TI-83 are given, right down to the screen...


