Houghton Mifflin Harcourt
Holt, Rinehart and Winston: Homework Help Independent Practice: Scatter Plots
Get independent practice working with scatter plots. Each incorrect response gets a text box explanation and another try. Correct responses are confirmed.
University of Regina (Canada)
University of Regina: Math Central: Scatter Plots
Three different concepts are examined about scatter plots. Topics featured are collecting data, analyzing scatter plots, and determining a line of "best fit". The lesson has an overview, material, procedures, and evaluation techniques.
Wolfram Research
Wolfram Math World: Histogram
This MathWorld site offers a clear definition and examples of a histogram.
Texas Instruments
Texas Instruments: Comparing Distributions of Univariate Data
Students compare univariate data distributions using statistical concepts like box plots, stem plots, and histograms.
Texas Instruments
Texas Instruments: How Tall? Describing Data With Statistical Plots
In this activity, students' will measure their heights using a motion detector and describe the data using the statistical concept called box plot.
Texas Instruments
Texas Instruments: Mc Dougal Littell Algebra 1: Box and Whisker Plots
Students will make a box-and-whisker plot and list the first, second, and third quartiles.
Texas Instruments
Texas Instruments: Mc Dougal Littell Algebra 1: Graphing a Scatter Plot
Students will make a scatter plot and explore any patterns.
Other
Nmu: Boxplot Introduction
This site provides an excellent introduction to boxplots. Additional links related to components of boxplots are included.
Math Planet
Math Planet: Algebra 2: Line Plots and Stem and Leaf Plots
Provides examples and a video lesson that illustrate line plots and stem-and-leaf plots. [1:12]
CK-12 Foundation
Ck 12: Statistics: Box and Whisker Plots Grades 8 9
[Free Registration/Login may be required to access all resource tools.] Learn how to use box-and-whisker plots to analyze data.
CK-12 Foundation
Ck 12: Algebra: Fitting Lines to Data
[Free Registration/Login may be required to access all resource tools.] Make a scatter plot of data and find the line of best fit to represent that data.
CK-12 Foundation
Ck 12: Statistics: Box and Whisker Plots Grades 9 10
[Free Registration/Login may be required to access all resource tools.] Make and interpret a box-and-whisker plot for a set of data.
Other
Sky Mark: Scatter Plots
This page gives a description of scatter plots along with examples. Also provides explanations and statistics to aid student understanding.
Discovery Education
Discovery Education: Web Math: Plot of a Mathematical Expression
This WebMath site provides an interactive 'solvers' to plot x and y coordinates on a graph.
Shodor Education Foundation
Shodor Interactivate: Lesson: Box Plots
This lesson plan introduces quartiles and box plots. It contains an activity and discussion. Supplemental activities about how students can represent data graphically are also included.
University of Regina (Canada)
University of Regina: Math Central: Scatter Plots
Three different concepts are examined about scatter plots. Topics featured are collecting data, analyzing scatter plots, and determining a line of "best fit". The activity has an overview, material, procedures, and evaluation techniques.
McGraw Hill
Glencoe Mathematics: Online Study Tools: Scatter Plots
This site gives a short interactive quiz which allows students to self-assess their understanding of the concept of scatter plots.
National Council of Teachers of Mathematics
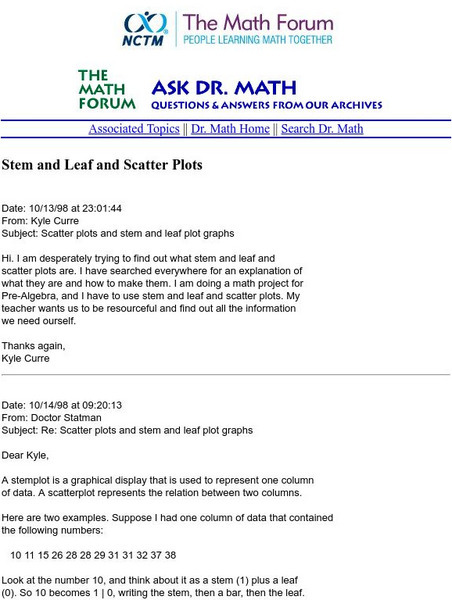
The Math Forum: Nctm: Ask Dr. Math: Stem and Leaf and Scatter Plots
This site is a question/response page which focuses on stem-and-leaf representation and how to construct scatter plots. Dr. Math works through an example and gives commentary notes. Site also contains links for more help.
Oswego City School District
Regents Exam Prep Center: Practice With Organizing and Interpreting Data
Several problems are presented to test your skills in creating and interpreting frequency tables, pie charts, box-and-whisker and stem-and-leaf plots.
McGraw Hill
Glencoe Mathematics: Online Study Tools: Box and Whisker Plots
This site gives a short interactive quiz which allows students to self-assess their understanding of the concept of box-and-whisker plots.
Math Planet
Math Planet: Stem and Leaf Plots and Box and Whiskers Plot
Discover how to use stem-and-leaf plots and box-and-whisker plots to visualize data by taking a look at examples and a video lesson.
Math Planet
Math Planet: Scatter Plots and Linear Models
Provides examples and a video lesson that explains scatter plots.


