Texas Instruments
Texas Instruments: The Normal Distribution
Students graph normal distributions, shade desired areas, and find related probabilities. They graph Normal probability scatter plots to check the normal (linear) shape of a data distribution.
Other
Vlps: Mean and Standard Deviation
Explanation of frequency distributions, mean, standard deviations, and variance including a Java Applet.
Michigan Technological University
Computing Mean, Variance and Standard Deviation
Page centered around a computer program to determine mean, variance, and standard deviation.
Khan Academy
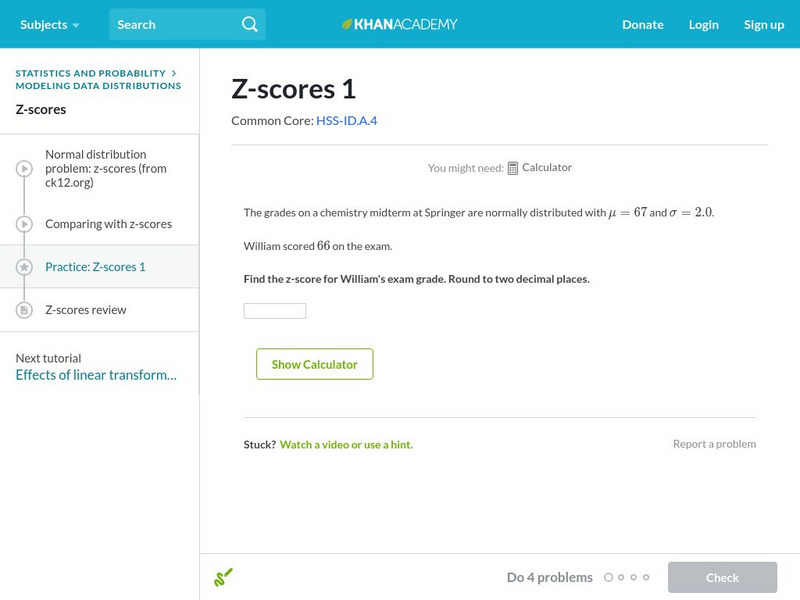
Khan Academy: Z Scores 1
Find the z-score of a particular measurement given the mean and standard deviation. Students receive immediate feedback and have the opportunity to try questions repeatedly, watch a video or receive hints.
Math Planet
Math Planet: Algebra 2: Standard Deviation and Normal Distribution
Gain an understanding of standard deviation and normal distribution by viewing an example and a video lesson.
Khan Academy
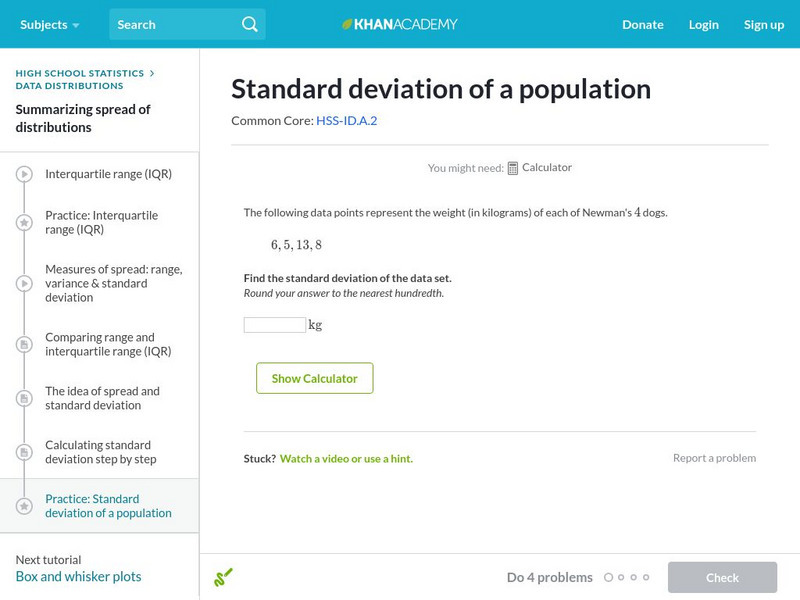
Khan Academy: Standard Deviation of a Population
Calculate the standard deviation of a population. Students receive immediate feedback and have the opportunity to try questions repeatedly, watch a video or receive hints.
Khan Academy
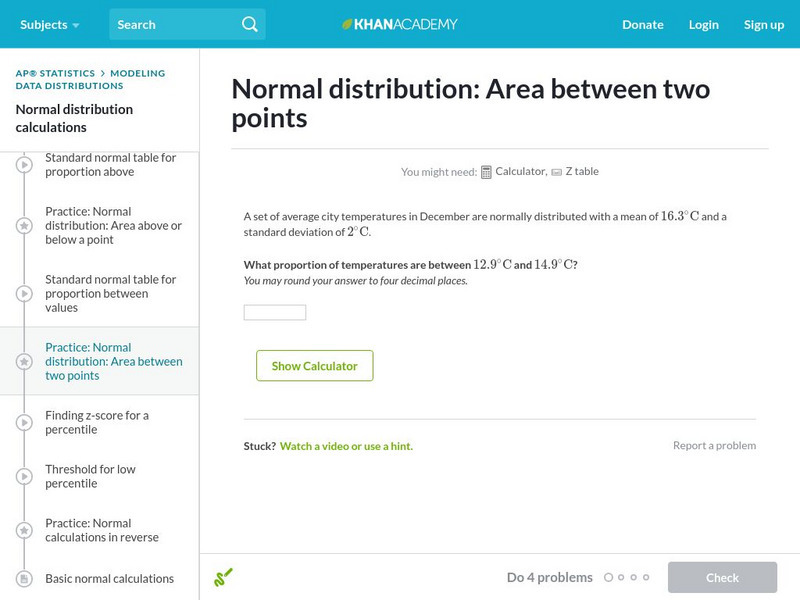
Khan Academy: Normal Distribution: Area Between Two Points
Use a z-table to find the probability that a particular measurement is in a range. Students receive immediate feedback and have the opportunity to try questions repeatedly, watch a video or receive hints.
Illustrative Mathematics
Illustrative Mathematics: Understanding the Standard Deviation
The purpose of this task is to deepen student understanding of the standard deviation as a measure of variability in data distribution. The task is divided into four parts, each of which asks students to think about standard deviation in...
CK-12 Foundation
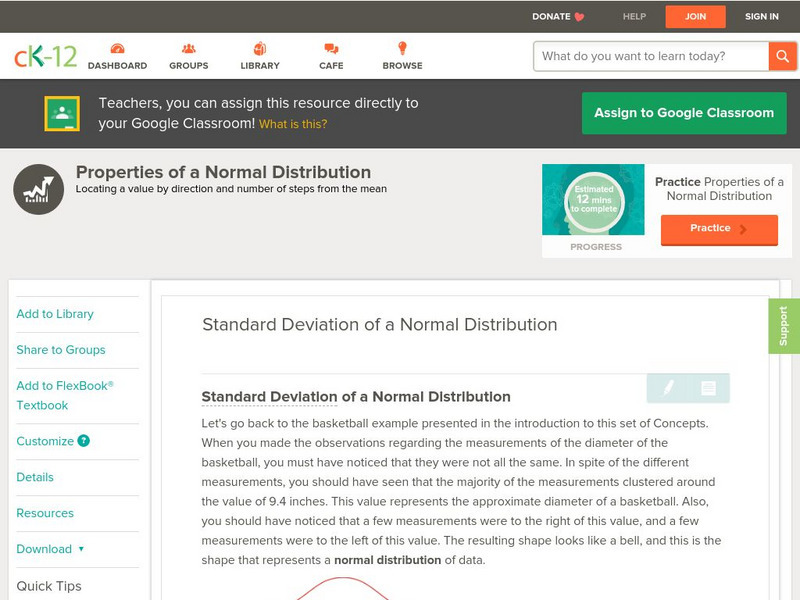
Ck 12: Statistics: Standard Deviation of a Normal Distribution
[Free Registration/Login may be required to access all resource tools.] Learn about the spread of a normal distribution.
CK-12 Foundation
Ck 12: Statistics: Measures of Spread/dispersion Grades 11 12
[Free Registration/Login may be required to access all resource tools.] This Concept introduces students to the some of the measures of spread commonly used, such as range, standard deviation and variance.
CK-12 Foundation
Ck 12: Mean and Standard Deviation of Discrete Random Variables
[Free Registration/Login may be required to access all resource tools.] This Concept teaches students how to find the mean and standard deviation for discrete random variables.
CK-12 Foundation
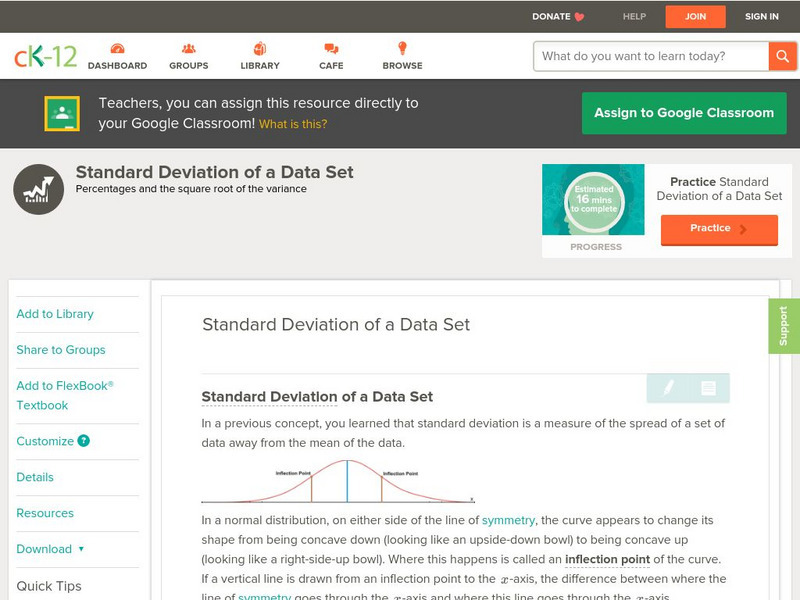
Ck 12: Statistics: Standard Deviation of a Data Set
[Free Registration/Login may be required to access all resource tools.] Learn about standard deviation of normally distributed data.
Palomar Community College District
Palomar College: Behavioral Science Statistics: Variance and Standard Deviation
A series of step-by-step worked problems demonstrating how to take a set of data and produce the variance and standard. Hints are provided along the way and the final measures are shown for the user to check.
Shodor Education Foundation
Shodor Interactivate: Measures
Enter data and view the mean, median, variance, and standard deviation of the data set.
Shodor Education Foundation
Shodor Interactivate: Skew Distribution
Change the median and standard deviation of an automatically generated normal distribution to create a skewed distribution, allowing you to observe properties like what it means for the mean, median, and mode to be different.
Shodor Education Foundation
Shodor Interactivate: Normal Distribution
Change the standard deviation of an automatically generated normal distribution to create a new histogram. Observe how well the histogram fits the curve, and how areas under the curve correspond to the number of trials.
Khan Academy
Khan Academy: Standard Deviation of a Population
Calculate the standard deviation of a population.
CK-12 Foundation
Ck 12: Algebra Ii: 5.5 Sampling Variability
This section explores the concept of sampling variability in the sample proportion. It will address the effect on the mean and standard deviation of a sample distribution as the sampling size changes.
CK-12 Foundation
Ck 12: Algebra Ii: 5.4 Standard Deviation
Explore what the standard deviation is as it relates to the graph of a normal distribution curve.
CK-12 Foundation
Ck 12: Algebra Ii: 5.3 Normal Distribution
This section explores normal distribution curves that have a unique, bell-like shape and represent data that is "normally" distributed. It also addresses how many real-life situations can be modeled by normal distribution curves.
Khan Academy
Khan Academy: Normal Distributions Review
Normal distributions come up time and time again in statistics. A normal distribution has some interesting properties: it has a bell shape, the mean and median are equal, and 68% of the data falls within 1 standard deviation.
Wolfram Research
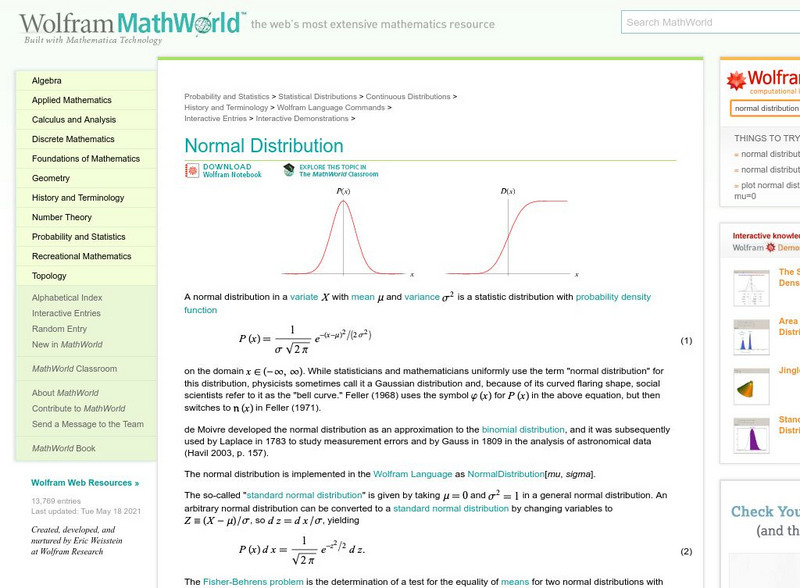
Wolfram Math World: Normal Distribution
Math World explains the normal distribution with links to help with unfamiliar topics and terms. The site explains how to convert from a normal distribution to a standard normal distribution. Some prior knowledge of statistics and normal...
Other
Berrie's Statistics Page: Graph of Normal Distribution
Explanation of the Normal Curve and the importance of the normal distribution
Other
Dispersion
This site discusses the range, average deviation, variance, and standard deviation, as well as their relation to dispersion.


