Texas Education Agency
Texas Gateway: Tea Statistics: Discrete Distribution (Playing Card Experiment)
In this Stats lab, students will work with a set of playing cards and a calculator. They will compare empirical data and a theoretical distribution to determine if an everyday experiment fits a discrete distribution. They will compare a...
Cuemath
Cuemath: Frequency Distribution Table
A comprehensive guide for learning all about frequency distribution tables with definitions, how to create a frequency distribution table, and the formulas and graphs related to frequency distributions. With solved examples and...
Cuemath
Cuemath: Discrete Data
A comprehensive guide for learning all about discrete data with definitions, the difference between discrete and continuous data, graphical representation of discrete data through visualization, solved examples, and interactive questions...
Wolfram Research
Wolfram Math World: Histogram
This MathWorld site offers a clear definition and examples of a histogram.
Wolfram Research
Wolfram Math World: Frequency Distribution
This site from MathWorld provides a general overview of frequency distribution, complete with a bar graph and explanatory text.
Yale University
Yale University: Categorical Data Examples
Site provides some different examples of categorical data and discusses the use of two-way tables.
TED Talks
Ted: Ted Ed: Hans Rosling Shows the Best Stats You've Ever Seen
Explore collected data in regards to life expectancies, family size, and finances through out the world and the various ways the data has been displayed.
Texas Instruments
Texas Instruments: Lights Out: Periodic Phenomena
In this activity, students can use a light sensor to collect intensity data for fast and slow variations of intensities. They will then describe these variations using the concepts of period and frequency.
Texas Instruments
Texas Instruments: Two Way Tables
This set contains statistics questions regarding two-way tables, marginal frequencies, and Simpson's paradox. The student gives an in-context interpretation to a row or column relative frequency expressed as a percent.
Texas Instruments
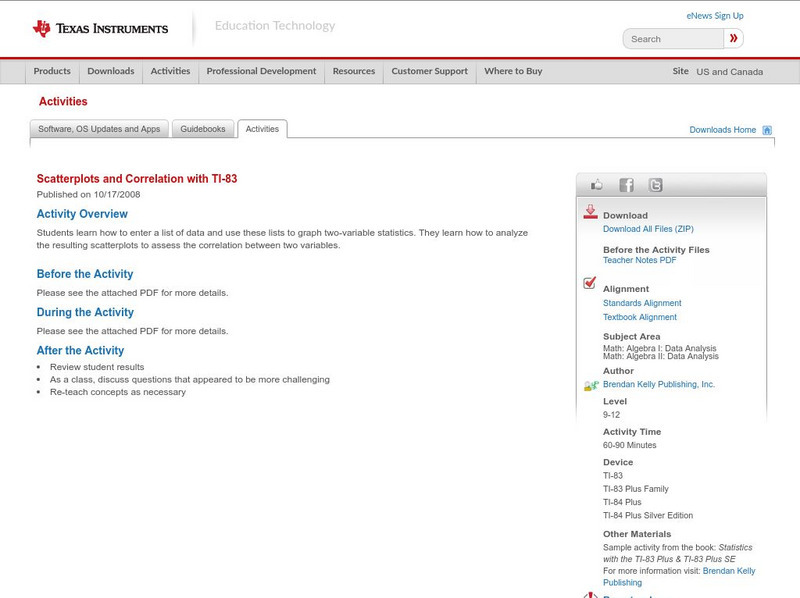
Texas Instruments: Scatterplots and Correlation With Ti 83
Students learn how to enter a list of data and use these lists to graph two-variable statistics. They learn how to analyze the resulting scatterplots to assess the correlation between two variables.
Texas Instruments
Texas Instruments: Frequency Data
Student activity for developing vocabulary with respect to frequency of data represented in various forms.
Texas Instruments
Texas Instruments: Summarizing Distributions of Univariate Data
Students understand statistical concepts like center of data and the amount of data variation from the center. They calculate the measures of the center of a distribution and the measures of spread for the data collected as a list....
Texas Instruments
Texas Instruments: Distributions and Univariate Data
This set contains statistics questions comparing distributions of univariate data. The student is asked to note the differences between distributions regarding center, shape, spread, and existence of outliers.
Palomar Community College District
Palomar Community College: Behavioral Science Statistics: Class Intervals
A sample problem on creating intervals for a frequency distribution. The example is worked out and explained along the way.
Palomar Community College District
Palomar College: Behavioral Science Statistics: Frequency Histogram an Example
A step-by-step worked problem demonstrating how to take a set of data and produce a frequency histogram. Hints are provided along the way and the final graph is shown for the user to check.
Other
Clayton State: Organizing & Presenting a Frequency Dist.
The easiest method of organizing data is a frequency distribution, which converts raw data into a meaningful pattern for statistical analysis. Learn how in this tutorial with examples.
McGraw Hill
Glencoe: Two Way Tables [Pdf]
This portion of an online textbook provides examples of two-way tables, vocabulary and practice problems.
Palomar Community College District
Behavioral Science Stats: Grouped Frequency Distribution
A sample problem that utilizes frequency distributions to find the frequency, relative frequency, intervals and cumulative relative frequencies for the given problem. The example is worked through step-by-step with a great explanation...
University of Texas at Austin
Mathematics Teks Toolkit: The Sounds of Music
In this lesson plan, students collect data, graph it, then determine the period and frequency of the sound waves made by a guitar.
McGraw Hill
Glencoe Mathematics: Online Study Tool: Quiz on Frequency Distributions
Learners demonstrate comprehension of advanced mathematical concepts. The online quiz tests the students on frequency distributions.
Science Education Resource Center at Carleton College
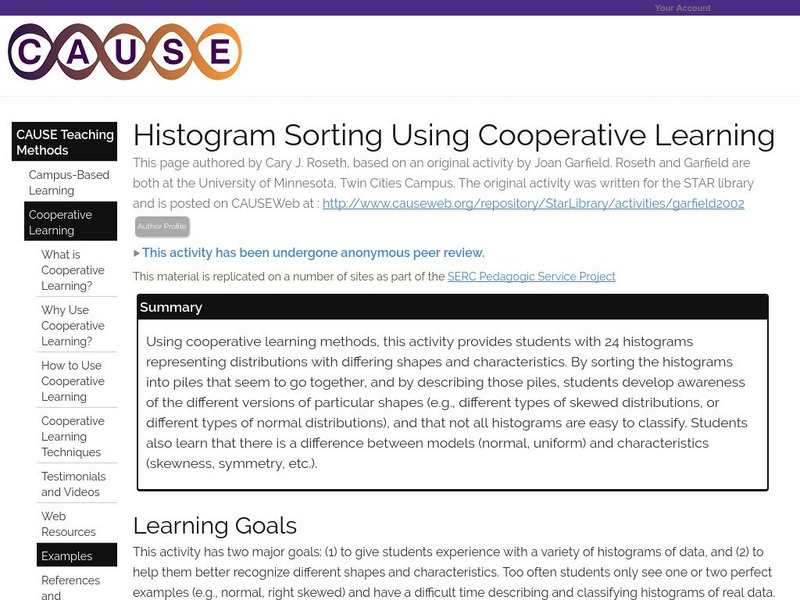
Serc: Histogram Sorting Using Cooperative Learning
Students work with 24 histograms representing distributions with differing shapes and characteristics. By sorting the histograms into piles that seem to go together, and by describing those piles, students develop awareness of the...
Science Education Resource Center at Carleton College
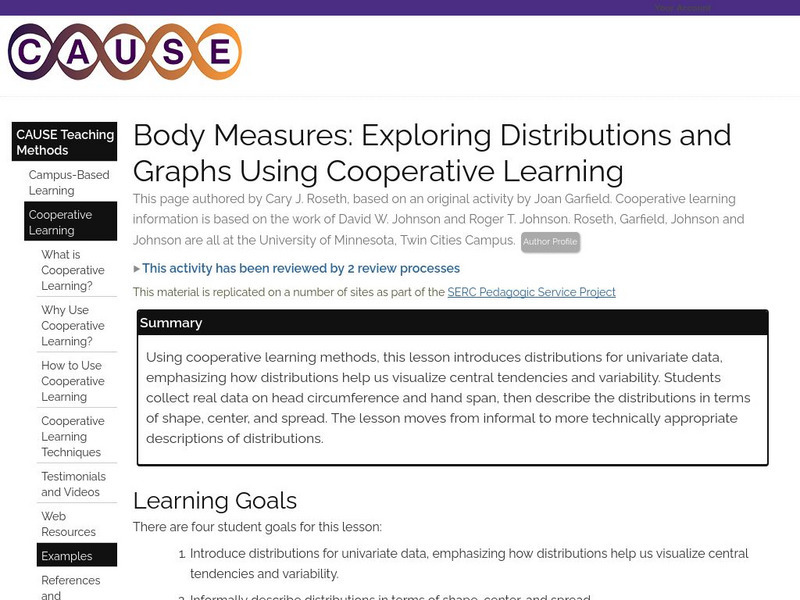
Serc: Exploring Distributions and Graphs Using Cooperative Learning
Using cooperative learning methods, this lesson introduces distributions for univariate data, emphasizing how distributions help us visualize central tendencies and variability. Students collect real data on head circumference and hand...
Mangahigh
Mangahigh: Data: Find the Class Interval Containing the Mode
Students watch an online tutorial on the concept of finding mode from a frequency table. After watching, students test their knowledge by attempting ten practice problems that increase or decrease in difficulty based on their answers.
Mangahigh
Mangahigh: Data: Two Way Tables
This site provides students practice with the concept of two way tables. Students can learn about the topic by completing an interactive tutorial. Students can then take a ten question timed test to practice the skill.


![Glencoe: Two Way Tables [Pdf] eBook Glencoe: Two Way Tables [Pdf] eBook](https://content.lessonplanet.com/knovation/original/108238-00003273f53572e51290174e1a53eb12.jpg?1661187814)


