Mangahigh
Mangahigh: Data: Use Frequency Tables
This site provides students practice with the concept of frequency tables. Students can learn about the topic by completing an interactive tutorial. Students can then take a ten question timed test to practice the skill.
Mangahigh
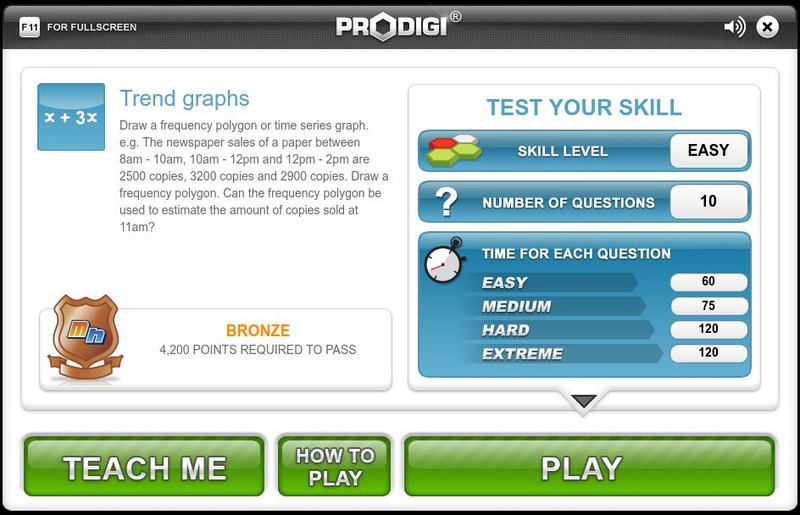
Mangahigh: Data: Trend Graphs
Students explore the concept of frequency trend graphs by working through an online tutorial and then attempting a ten question quiz that increases in difficulty as questions are answered correctly.
CK-12 Foundation
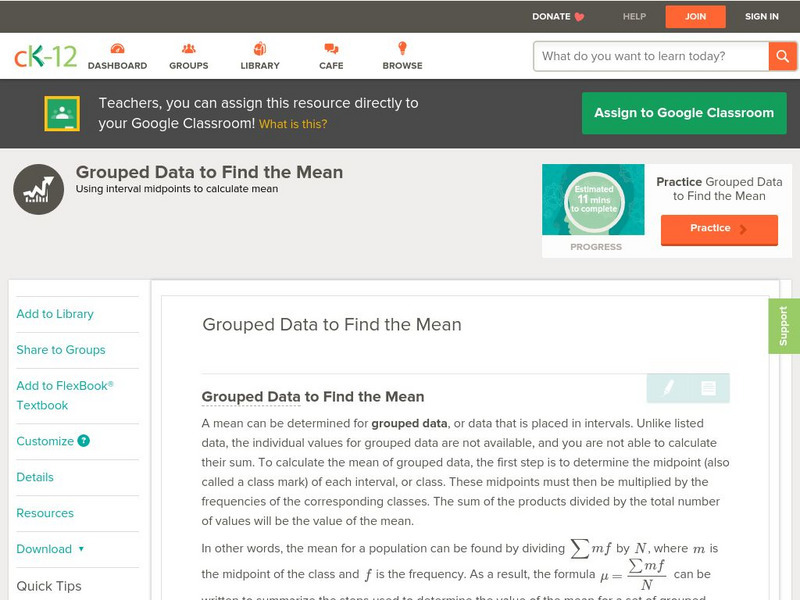
Ck 12: Statistics: Grouped Data to Find the Mean
[Free Registration/Login may be required to access all resource tools.] Covers frequency distribution tables with grouped data.
CK-12 Foundation
Ck 12: Statistics: Histograms Grades 11 12
[Free Registration/Login may be required to access all resource tools.] This Concept covers making frequency tables and using them to create a histogram.
Sophia Learning
Sophia: Continuous Data
Continuous data is defined and examples are given in this lesson.
Texas Instruments
Texas Instruments: Describing One Variable Data
Students sort data and display it graphically using various plots. They also get familiarized with statistical concepts like measures of spread and central tendency.
Texas Instruments
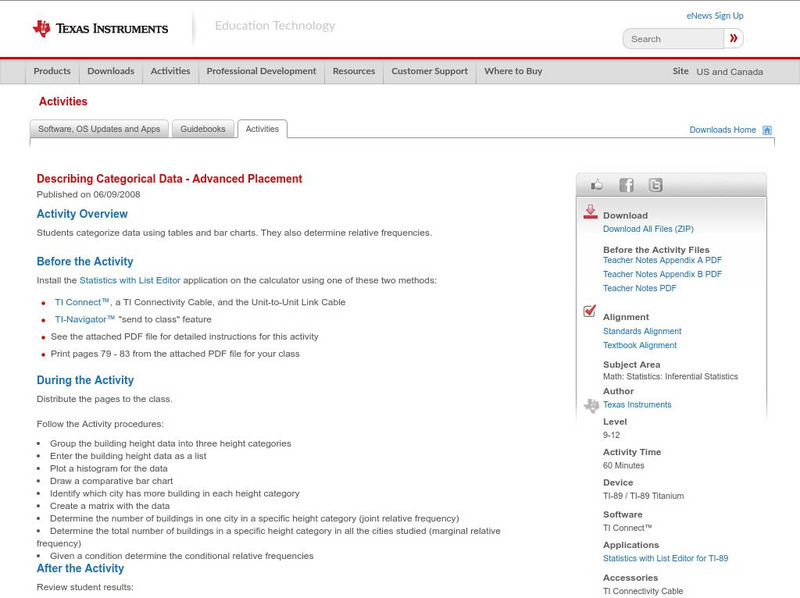
Texas Instruments: Describing Categorical Data Advanced Placement
Students categorize data using tables and bar charts. They also determine relative frequencies.
Texas Instruments
Texas Instruments: Describing Categorical Data
Students analyze the distribution of categorical data. They calculate percents and visually compare the data sets with a bar chart.
Science Education Resource Center at Carleton College
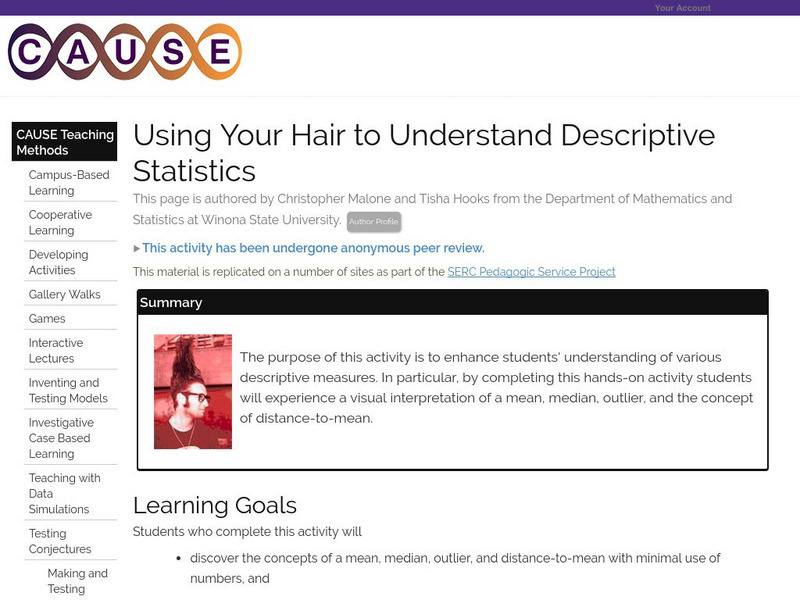
Serc: Using Your Hair to Understand Descriptive Statistics
Enhance students' understanding of various descriptive measures with a visual interpretation of a mean, median, outlier, and the concept of distance-to-mean.
National Council of Teachers of Mathematics
The Math Forum: Data Collecting Project Stats Class
This lesson plan provides the teacher with all the necessary handouts and directions to give a statistics class when they are ready to complete a thorough survey project. Broken into five parts, it takes the students through the...
Other
Stat Trek: Two Way Tables
This website provides students instruction on how to construct and interpret two-way tables.
Khan Academy
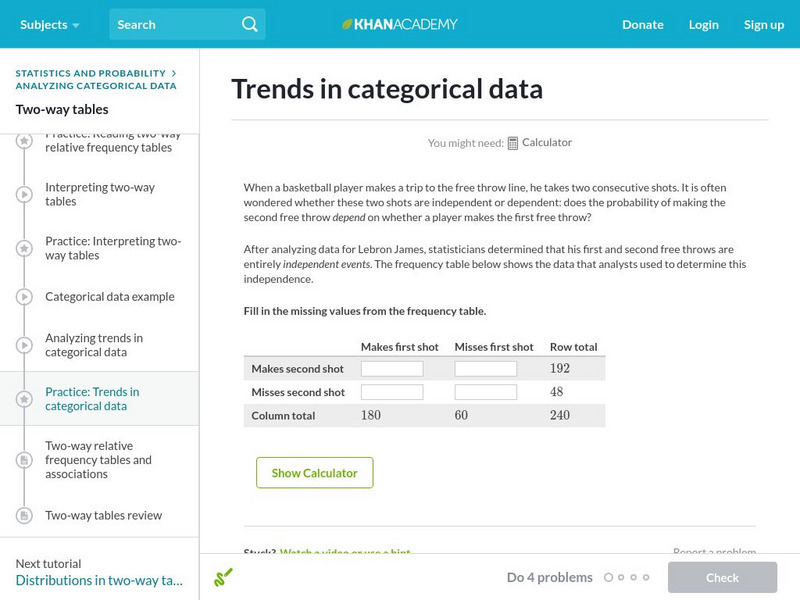
Khan Academy: Trends in Categorical Data
Analyze categorical data to find some trends. Students receive immediate feedback and have the opportunity to try questions repeatedly, watch a video or receive hints.
Other
Stat Trek: Data Patterns in Statistics
This lesson looks at how to recognize patterns in a data display by examining the shape of a graph, the center, the spread, and unusual features such as outliers. Includes video. [11:16]
CK-12 Foundation
Ck 12: Statistics: Displaying Categorical Variables
[Free Registration/Login may be required to access all resource tools.] This Concept covers a few ways in which categorical data can be displayed; using bar graphs and pie graphs.
National Council of Teachers of Mathematics
Nctm: Illuminations: Histogram Tool
This tool can be used to create a histogram for analyzing the distribution of a data set using data that you enter or using pre-loaded data that you select.
Shodor Education Foundation
Shodor Interactivate: Comparison of Univariate and Bivariate Data
Learners learn about the difference between univariate and bivariate data and understand how to choose the best graph to display the data.
CK-12 Foundation
Ck 12: Interactive Geometry: 11.4 Two Way Frequency Tables
With two pieces of data, learn how to organize the data into a two-way frequency table.
PBS
Pbs Learning Media: Central Tendency: Targeted Math Instruction
At the end of this lesson, students will be able to recognize and apply the concepts of mean, median, and mode in real-life problems.
Wolfram Research
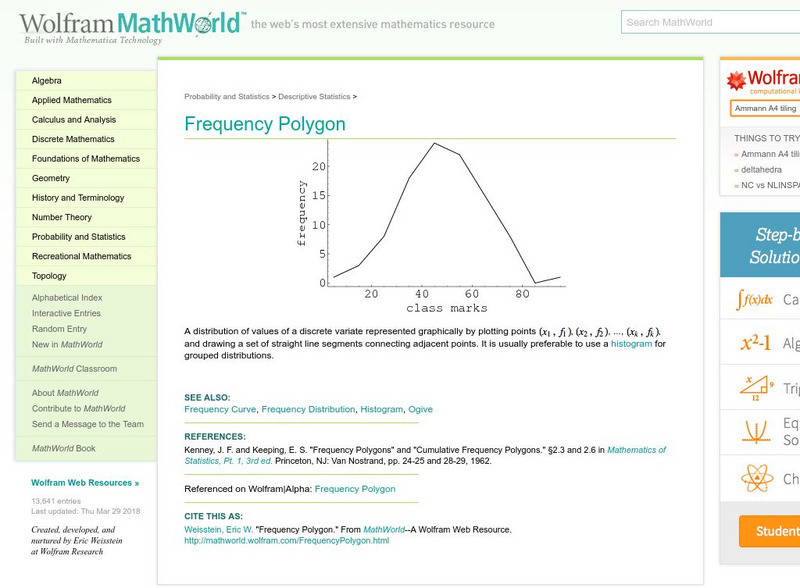
Wolfram Math World: Frequency Polygon
MathWorld provides a general overview of a frequency polygon, complete with a graphical example.
York University
York Univ.: Statistical Graphics for Multivariate Data
Provides several graphical representations of multivariate data. This paper explains the graphs such as the scatter plot and several other graphs as well. Site is presented in notes and outline format.
Rice University
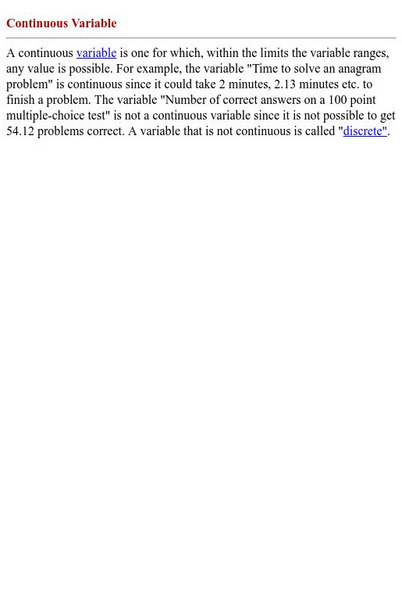
Hyper Stat Online Statistics Textbook: Continuous and Discrete Variables
The basic definitions of continuous and discrete statistics variables are provided here.
Stefan Warner and Steven R. Costenoble
Finite Mathematics & Applied Calculus: Histogram and Probability Distribution Generator
The learning tool displays data in the form of a histogram. The tool also shows descriptive statistics and probability distributions. Examples of data are included.
Illustrative Mathematics
Illustrative Mathematics: What's Your Favorite Subject
This website provides a task in which students interpret data in a two way table by calculating the relative frequencies of a data set.


